Large models are moving towards large-scale online services, and a common but somewhat counter-intuitive phenomenon is that more and more cables are being produced and more and more slowly are being swallowed.
Where is the problem? In deployments of MoE models such as DeepSeek, multi-group computing cards handle a large number of requests in parallel, with each group processing their own requests and decoding each step together through cross-group communication.
What is even more troubling is that even if the requests are as much divided, the actual burden for each group may be different, so that a lighter set of pre-calculations, such as empty, and the busiest set become the norm. This waiting will happen repeatedly with the token generation, with each step being the same, accumulating, and the gains from the deployment of scale expansion are eaten up.
So the bottleneck isn't in math, it's in "who's waiting for who".
To address this bottleneck, a team from Hong Kong University of Science and Technology and the Department of Theory of the Laboratory of Huawei 2012 have proposed BalanceRoute. The team's idea is straightforward: first clarify the problem, then talk about optimization, that is, through mathematical modeling, synchronized waiting, and then convert short-term load predictions into online routing decisions.
In the paper's 96 card experiment, the BR-H was the strongest baseline compared to the actual predictor, and decoding throughput improved by about 15%.
The work has been taken over by NeurIPS 2026 and has been deployed on the partnership MaaS reasoning service system MathBot-Pie.
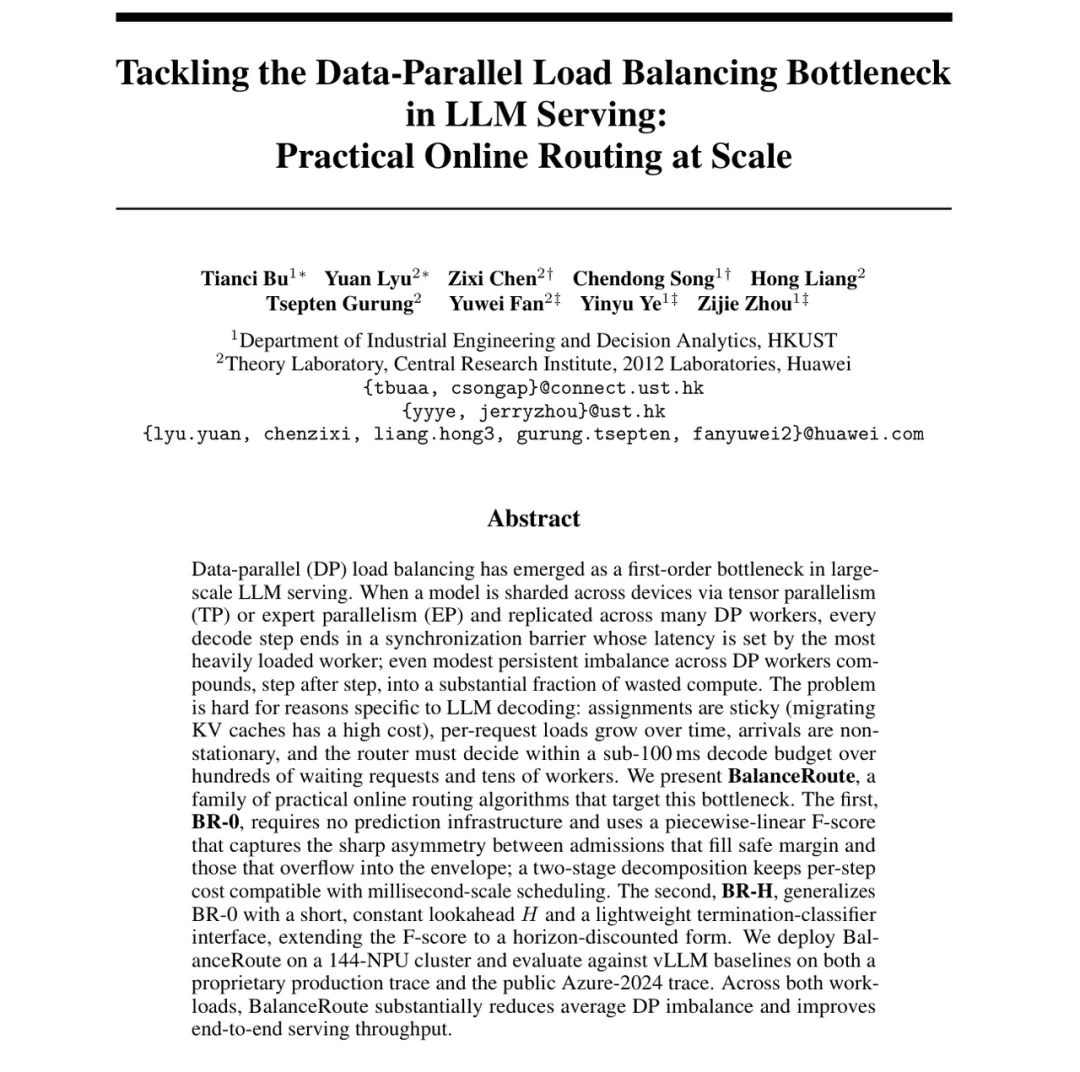
Tackling the Data-Parallel Load Balancing Bottleneck in LLM Serving: Practical Online Routing at Scale
Link to the paper:https://arxiv.org/pdf/2605.06113
The code link:https://github.com/b010001y/BalanceRoute
The number of requests is equal.
The load will still be different
Large models generate responses, typically divided into two phases: pre-filled (prefill) and decoded (decode). Pre-filled processes the entire input before the intermediate results are stored in a KV cache; decoded and output tokens are generated one at a time. Each generation step requires reading KV information from the previous input and the corresponding content generated.
In this paper, the pre-filled KV decoding separation (PD separation) system, the two stages are taken over by different computing resources. Once the pre-filled request is complete, the router chooses a decoding work unit for it, and the existing KV caches are passed along. A unit can consist of multiple computing cards.
Methods such as routing can be used to assign new requests to groups without differentiating how much KV information each request needs to process. Similarly, processing two requests can result in more caching in the context, and the burden of single-step reading and computation can also be heavier. Therefore, the number of requests is the same under synchronous constraints, with lighter groups waiting for heavier groups.
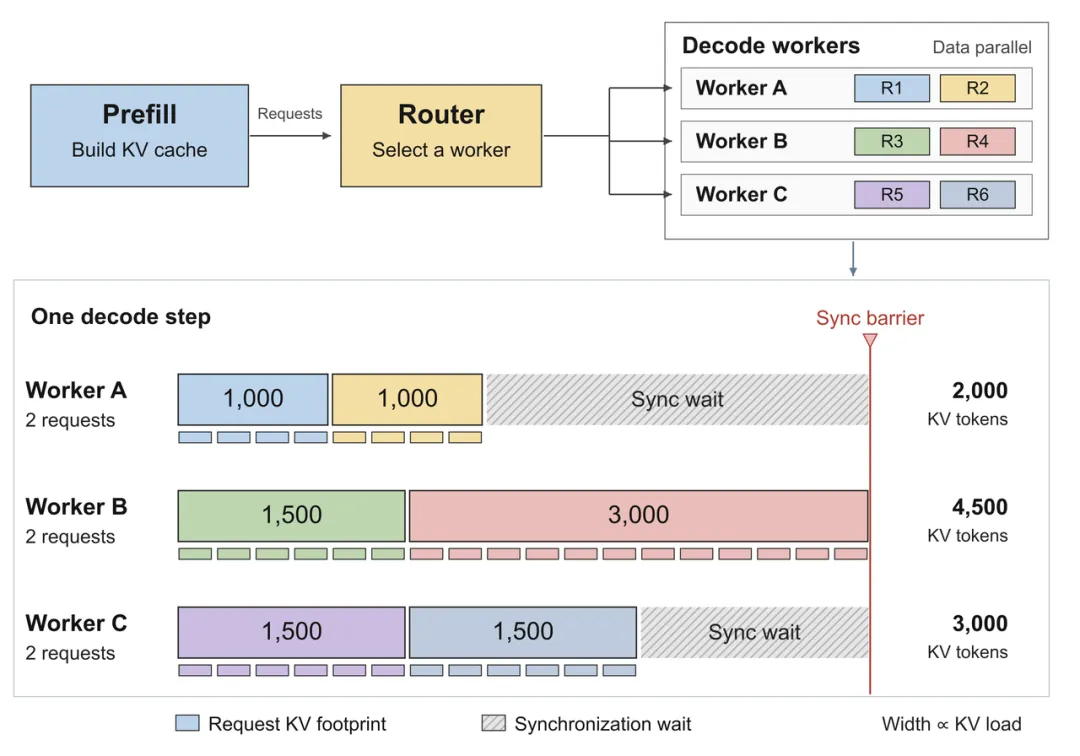
After the pre-filing is completed, the request is assigned to the decoding work unit. The following shows the calculation and synchronization of the decoding steps in this text deployment: each group is two requests, with a different total of KVs, and the lighter group will wait for the busiest group.
Loads also change with generation. Each time a token is generated, the request is added to the corresponding KV information, the next step is to process the upper context as well, the request is completed, and the subsequent decoding calculations are withdrawn. At the same time, the pre-fill side is also sending new requests.
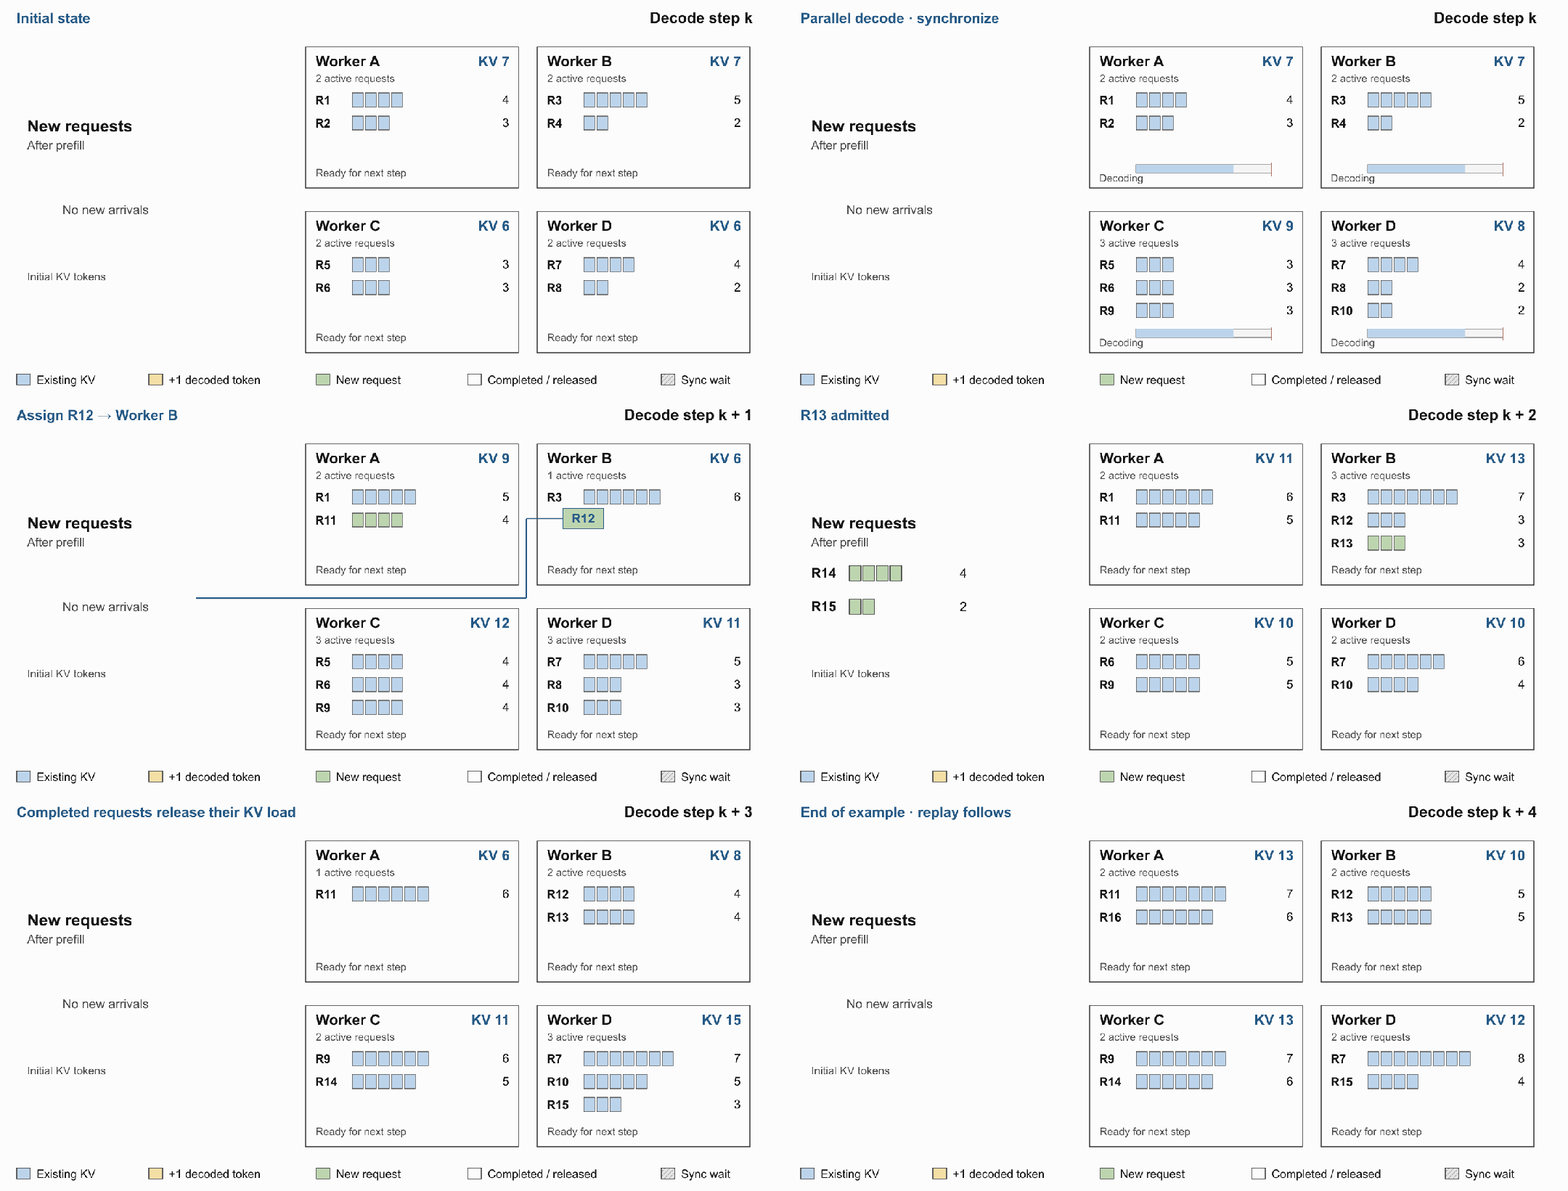
Figure 2 Load changes in decoding: New requests are added with pre-filled KV caches, requests have been generated with increase, and completed requests are withdrawn.
Considering this expense, the paper adopts the setting of not moving after allocation: the router must make a choice when the output length is unknown; the load changes continuously; the request then remains in the unit until the end.
Mathematical modeling
Making synchronized waiting a decision-making goal
From each step of the synchronous relationship, the weight difference between the units and the heaviest units is calculated using mathematical modeling. In step k, the unit g is loaded as L_g (k), the heaviest unit is loaded as M (k), and there are a total of G units. The single-step imbalance can be written:

I (k) The larger the quantity, the more unequal the arithmetic distribution between the units. This indicator depicts a parallel waiting corresponding void, with the long-term goal of reducing its accumulation in successive decoding steps.
For example, in Figure 3, the four groups of loads are 10, 7, 6, 5, where I (k) is 12. Add 4 units of load to C, which coincidentally fills the gap with the heaviest unit, and I (k) decreases to 8; if you add 5, C becomes the new heaviest unit, so that the other three groups are equal to one, and I (k) is 11.
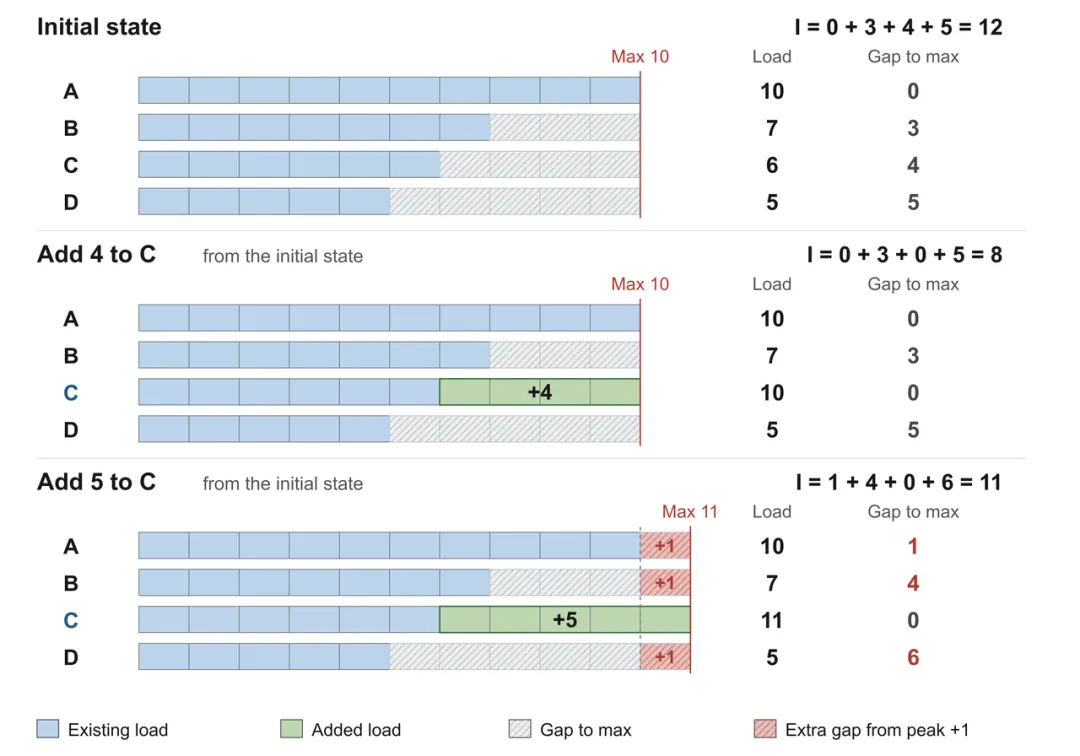
Figure 3 shows the balance between filling the gap and lifting the peak. Both access schemes start from the same initial state; blue for already loaded, green for added load, slope for gap gap, and pink for the additional wait resulting from rising peak. Numbers represent the units of load.
This example reveals the key balance of allocation: access to new requests can fill in the gaps of lighter units, but if it is introduced into new heaviest units, the wait for other units will increase. This comparison will then need to be extended to several future steps.
How far are we going to go?
It depends on what information the route really needs.
The effect of one allocation continues until subsequent decoding. Both groups are equally busy at the moment, and one group may quickly release load if the request is about to end. The BR-H of BalanceRoute therefore introduces the H-step window to estimate recent load changes in each group.
The longer the window isn't the better. H is too short to see the end of the request; H is too long, and even if the length of the existing request is predicted accurately, new requests and subsequent allocations that have not yet arrived will also change the load, making it difficult to determine further states.
Predictive objectives are also specified: for a running request, first estimate the probability that it will end in the window, then estimate how many steps it will take if it ends in the window. The two together give how long it is expected to run in the window. If the request continues beyond the window, it is not necessary to accurately distinguish how much content it will generate further away.
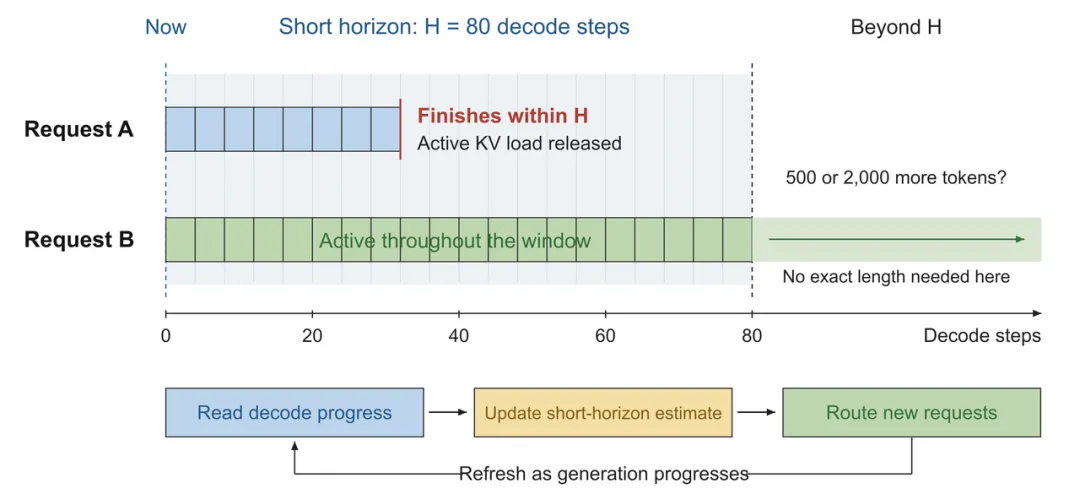
Figure 4 predicts the end of the request in the window, forming a short-term load estimate, and then scores, allocates and updates accordingly. The column above shows how long the request has been active; H=80 for the sample window, A, B for the sample request.
These predictions eventually become specific allocations. BR-H first estimates the load of the future H-step of each unit, then compares how many gaps can be filled each step after accessing the candidate's request, and how much additional waiting will result, combining the gains and costs into a score, and reducing the weight of further steps.
Each post-access update is expected to load, and the next round is re-judged based on the latest operating status. Forecasting, rating and allocation thus form a continuous update process.
From models to millisecond routing in real systems
For the model to be profitable, routing decisions need to keep pace with decoding. The team implemented a state agent on top of the vLLM-Ascend, unifying the work unit's loads, slots, and generating progress. The pre-filled requests entered the waiting pool first, allowing the BR-H to combine the distribution of candidate requests against the overall state; the decoding end's flow feedback continued to update the generating progress. This set of designs uses existing interface access without modifying the propulsion engine core. The system predicts, increases the update load, and combines selection limits within a small-scale candidate set to control the deployment of each turn.
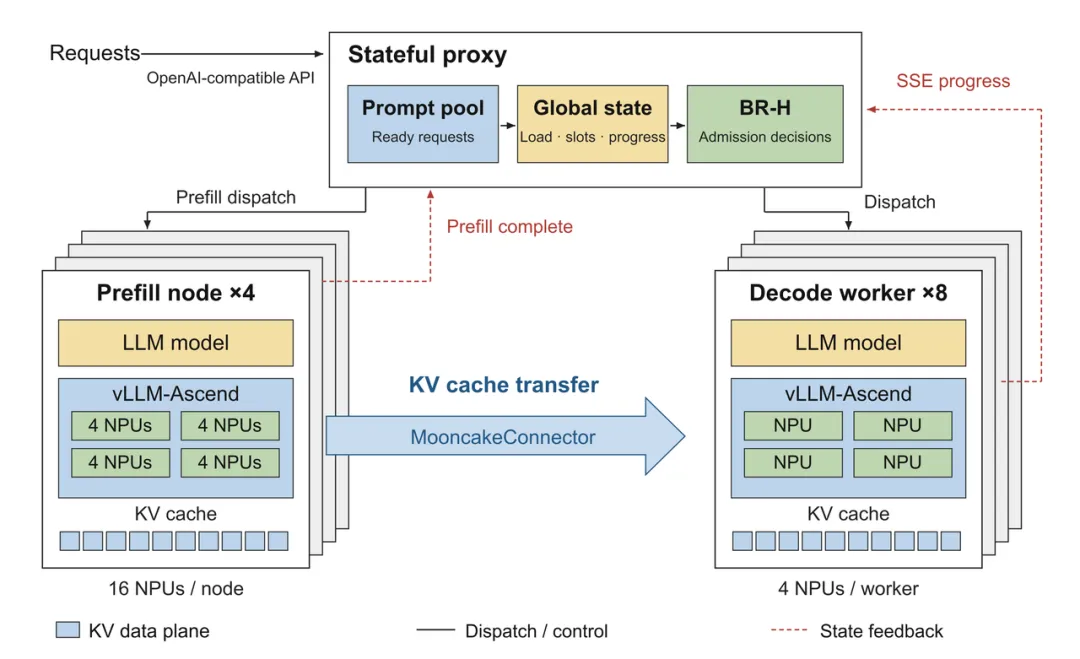
Figure 5 simplifies the structure of the system. The gray real line represents the scheduling, the blue rough arrow represents the KV transmission, and the red empty line represents the state retransmission.
The main experiment used 96 elevated 910C NPUs running DeepSeek-V3 671B ((W8A8), which contained eight decoding work units. In this deployment, the median time spent on single-wheel scheduling was 1.20 milliseconds, with a 99% allocation of 2.77 milliseconds, below the single-step decoding time budget of about 60 milliseconds.
In high-load conditions close to saturation, the team recycled enterprise production request records and public Azure 2024 request records, comparing them to four common routing strategies such as routines, shortest queues. Using actual BR-H predictors, the highest baseline throughput relative to each dataset, decoding throughput increased by 15.4% and 14.5%, respectively, and the tail delay between output tokens decreased at the same time. These gains came from the same model and the improvement in allocation requests under NPU configuration.
Figure 6 shows decoding throughput under the actual forecaster. Figure 6 shows the contrast between the vllm-router baseline and the BR-H.
In terms of system applications, BalanceRoute has deployed the MathBot-Pie-MathBot-Pie, a co-developed MaaS reasoning service system based on cache-perceived scheduling as a framework for rapid automatic adaptation through Agent, as well as the automated construction and optimization of high-performance algorithms and models, integrated reasoning frameworks, model computation and combined optimization of underlying algorithms, to achieve low latency and high-performance pricing; while BalanceRoute is the key to reducing cross-group synchronization waits and improving online decoding throughput.
How to write in a logical system
In the process of cross-group synchronization, where requests are continuously reached, KV caches are generated with growth, requests are terminated and loads are released, and these changes are interconnected, making it difficult to directly judge the impact of a single allocation on overall efficiency. By modeling these relationships, the team refined the load imbalance indicator I (k) that reflects synchronized waiting, transforming the routing problem into an optimization problem with a clear goal.
Alongside this goal, the team further analyzed the changes in load over time and focused on predicting which requests will end in the near future, forming short-term forecasts and routing strategies, and validating gains in real systems.
This was also the starting point for the Hong Kong University of Science and Technology's Zhong Jie team to explore OR for LLM serving: understanding complex systems through modeling and clearly identifying what to optimize and what information is needed to guide practical decision-making.
© THE