With the improvement in model capabilities, model evaluation also faces new challenges.
Part of the evaluation benchmarks are close to zero, the model scores are increasingly difficult to draw a gap, and the reference value of the run score is decreasing. Which benchmarks are still valid, and what more can the scores indicate?
To address this, a research team from Ali Data attempted to give an answer in the paper Benchmark Health Index: A Systematic Framework for Benchmarking the Benchmarks of LLMs, which has been received by NeurIPS 2026 Evaluations and Datasets Track (Oral) as one of 15 Oral papers in the course.
Based on the technical reports of 117 models, the team compiled and screened 158 evaluation benchmarks, presented the Benchmark Health Index (BHI), a three-dimensional approach to ability differentiation, resistance and impact, and gave the models "measurements" to analyze whether they could still provide model comparisons with reference value.
Benchmark Health Index: A Systematic Framework for Benchmarking the Benchmarks of LLMs
It was written by Longyuan Zhu, Hairan Hua, Linlin Miao, Wei Wang, Bing Zhao.
This is the first time I've ever heard of this phenomenon.
This is a list of the most commonly used data types in NeurIPS 2026 Evaluations and Datasets Track
Is the scale used to evaluate the model?
On some benchmarks, the scores of the head models are gradually approaching, and the problem of "point compression" arises, with small differences that may be influenced by statistical noise, making it difficult to effectively distinguish the strength of the model.
Long-term fixed assessment topics may be incorporated into the pre-training data, where previously learned grades may not reflect the model's real capabilities, and the challenge space for evaluating the benchmark shrinks as the model runs closer to the upper limit. A benchmark that can still distinguish models today may tend to blur tomorrow, showing the "ceiling effect".
These issues make updating and selection of benchmarks extremely important.
Another set of more difficult questions won't work. If all the models don't answer, the scores won't work the same way.
Reference quantities are also not the most reliable selection basis. Some evaluation benchmarks are frequently cited, but do not represent widespread adoption by leading models.
How to screen for a high quality benchmark that still has effective region-specific modeling capabilities and continuous evaluation values?
A "physical examination" of the evaluation benchmark.
In 158 assessment benchmarks analysed in the paper, BHI's systemic diagnosis revolves around three main issues.
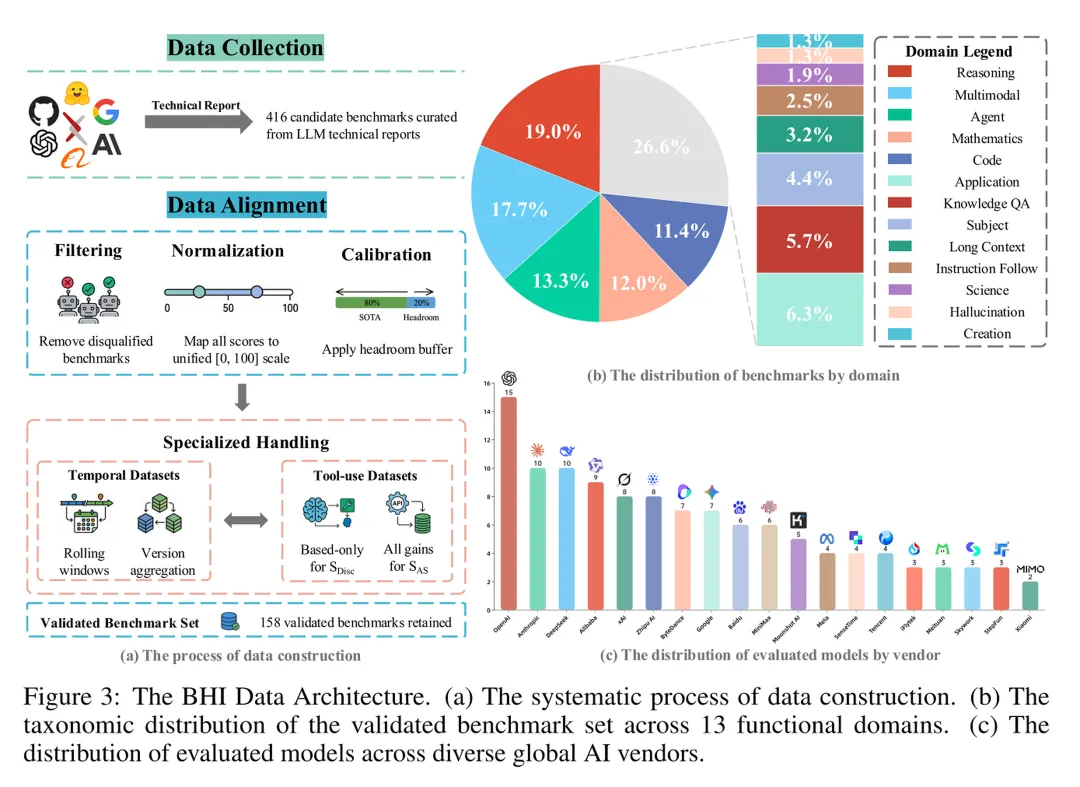
Construction and distribution of BHI research data. On the left is the benchmark selection and alignment process, on the right is the benchmark distribution across 13 task areas, and on the right is the number of models analyzed by each manufacturer.
Can evaluation benchmarks bridge the gap between models?
"Capacity differentiation" is a measure of whether scores can clearly represent model differences, avoiding perceiving excessive differences or a few extreme scores as distinguishing abilities.
BHI starts with a threshold of 2% of the difference between the highest score and the lowest score, statistically the difference exceeds the threshold; then takes the scores range of 10th to 90th percentile, observing the distance between most models. The higher the ratio, the larger the range, indicating that the better the model performs, the greater the gap can be drawn.
The higher the score, the more the benchmark distinguishes the model from the records collected; but above the threshold, the difference is not equal to the difference that has been passed through statistical significance testing.
How much room is left to improve the benchmarks?
"Anti-matching consistency" is not only about whether the model scores are close to completion, but also about the ability to participate in the model. Average scores are low, may be difficult to benchmark, or may be less involved in the model, and can't directly explain enough challenge space.
It first weighted the results according to model capabilities to estimate the current remaining upgrading space; at the same time, the matching scores changed over time to estimate 30 days to determine if the benchmark is approaching zero.
The two parts are synthesized in 8:2 to give greater weight to the current state, reducing the impact of short-term predictive uncertainty.
The higher the resistance score indicates that the benchmark retains a greater challenge space in the assessment records collected, but does not mean that it can accurately predict when it will collapse.
How does the evaluation benchmark cover the adoption in the actual evaluation?
The "impact" indicator does not directly involve data such as the popularity of the rating benchmark, the number of references, the number of downloads and the warehouse star rating.
It provides models with effective results in statistical reports and weighs the adoption on the basis of model capabilities, with higher evaluation benchmark weights for front-end model adoption to reflect the use of evaluation benchmarks in high-capacity model evaluations.
At the same time, the indicator does not rely on the release time of the benchmark or model, nor does it adopt an illuminated time decline, but is calculated on the basis of actual adoption to reduce historical heat accumulation interference with impact scores.
Consequently, the higher the impact score of the assessment benchmark, indicating that models with stronger capabilities are still using the benchmark more frequently in statistical assessment practices.
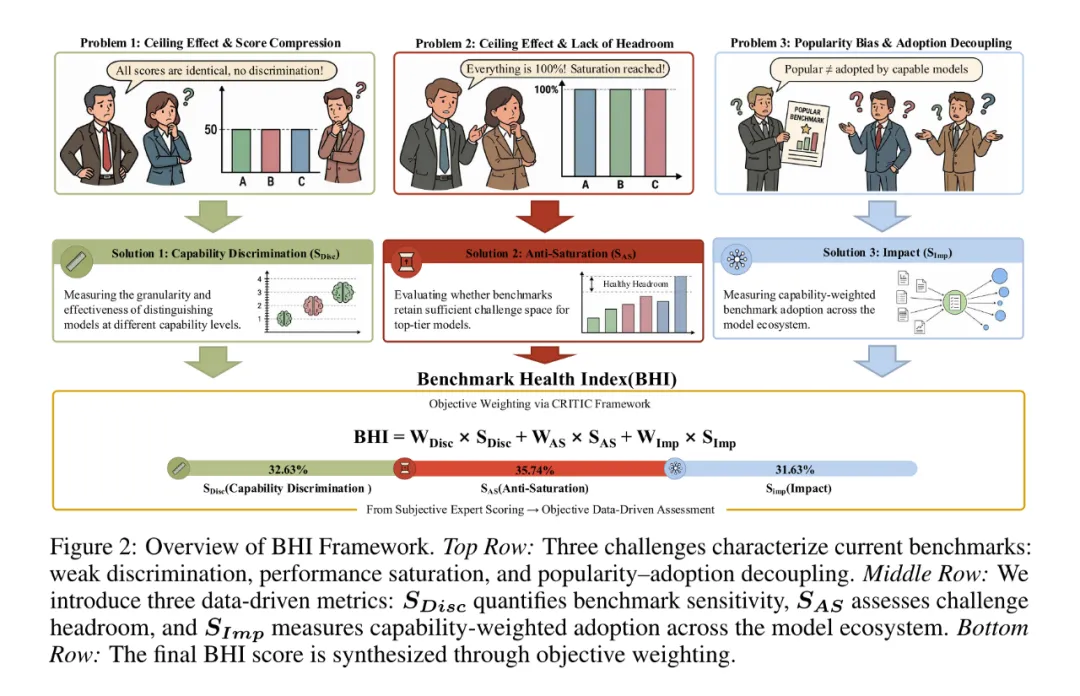
BHI synthesis method. CRITIC method identifies three dimensions of weight based on data: capacity differentiation of 32.63%, resistance of 35.74%, impact of 31.63%.
But who's going to judge a model's ability?
If the results on a benchmark estimate the strength of the model and then use it to evaluate the benchmark, the starting point is reversed.
For this purpose, the research team used LOBO (Leave a benchmark method): to examine a benchmark, exclude it first, and use the model to estimate performance on other benchmarks.
Finally, the CRITIC method, based on the amount of information in each dimension and the degree to which it relates to it, determines the weight and synthesizes the BHI. The total score is used for comparison, while the three dimensions help to see where the difference comes from.
Whoever gains, and whoever gains,
Based on the results of the three-dimensional assessment, BHI compiled a comprehensive ranking of current mainstream benchmarks:
Humanity's Last Exam (HLE) is ranked first in BHI 67.05, and Agents' Last Exam and AutomationBench are second and third in 53.08 and 52.68, respectively.
HLE's advantages are not concentrated in a single dimension. It can both differentiate models and retain challenging spaces, while having a wider capability of adding weight to coverage.
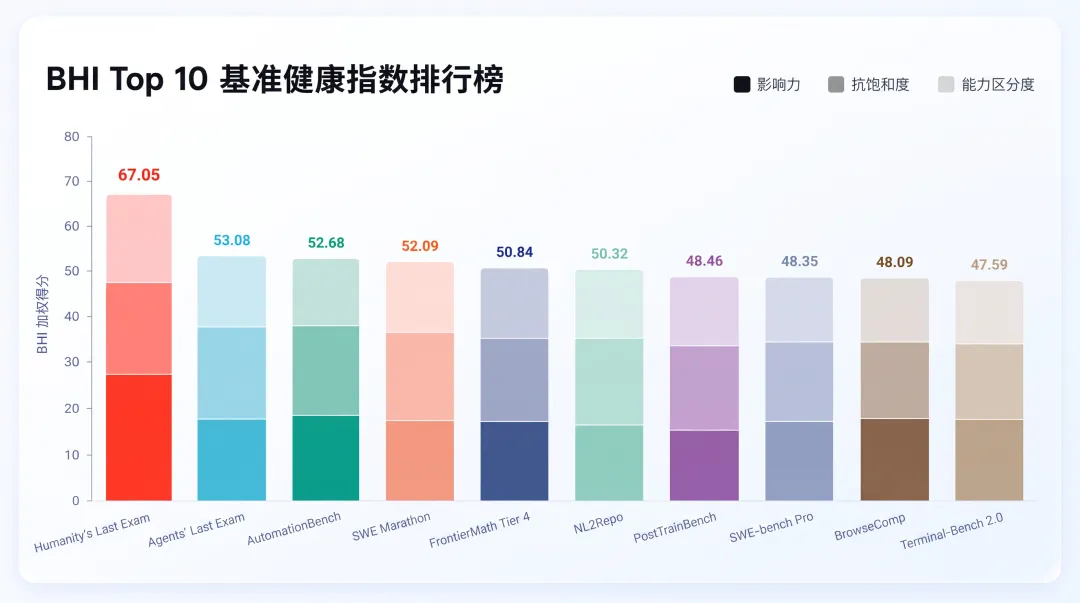
The top ten benchmarks for BHI aggregate scores. Column tops are aggregate scores, with color segments representing three-dimensional weighted contributions.
It is also possible to be good at different things.
AutomationBench is only 0.59 points behind the fourth-place SWE Marathon, but the former is more resistant and the latter more differentiated. The remaining challenge space is not always synchronized with the current differentiation capabilities.
The gap between the eighth SWE-bench Pro and the ninth BrowseComp was smaller, at 48.35 and 48.09 respectively.
However, BrowseComp's resistance to corrosion is also the lowest in the top ten. More high-capacity models are used, indicating that it has a certain proportion in the actual evaluation, but does not guarantee that the test will still have sufficient room for improvement.
The list is given later, and the divided dimensional results explain the difference. When selecting a benchmark, it is also necessary to see if these differences meet the assessment requirements of the specific task.
Are the results of the medical examination reliable?
Can a three-dimensional synthesized ranking effectively reflect the benchmark status of the assessment? Can this diagnosis remain stable and reliable when data or computational parameters change?
The team first attempted to remove any dimension and found that the final ranking was affected: after removing the resistance to saturation, the benchmark ranking changed by an average of 16.18 bits, with a maximum change of 82 bits. Removing the differentiation or influence also brought about significant changes. Both of the two related coefficients between the three dimensions were less than 0.5, further indicating that the information they provided was not fully replicated and could effectively complement judgments of the benchmark state from different angles.
The team further divided the two sets of benchmarks, "Known and Active Front", based on independent BHI calculations. The average BHI of the two sets, 0.227 and 0.600 respectively, matched the direction of external observation, further validating the BHI's ability to identify different benchmark health conditions.
Finally, if the evaluation records are incomplete, will the results be stable?
After randomly removing 30% of the models, the team found that the new and old Spearman ranking coefficients were still higher than 0.97, indicating a highly consistent ranking. The ranking also maintained better consistency after adding score noise, adjusted differential thresholds, and short-term prediction parameters.
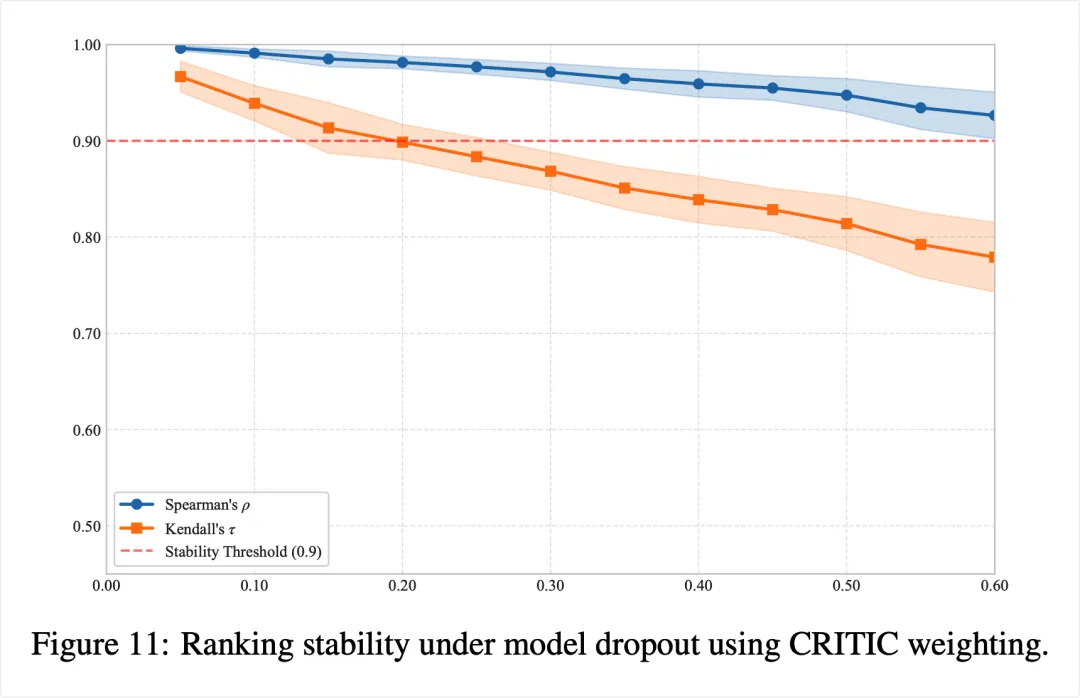
Ranking stability after randomly removing parts of the model. The horizontal axis is proportional to the removal, and the blue line is Spearman k, respectively.