The study was conducted by Haoming Wang and Wei Gao of the Department of Electrical and Computer Engineering at the University of Pittsburgh.
Look at a video of a room, a visual language model (VLM) that recognizes tables, chairs, and cabinets. But inside, are these objects organized by color, shape, or form a spatial map that contains neighboring relationships?
To answer this question, researchers at the University of Pittsburgh shifted the study perspective from the model's final answer to hidden space, which is the internal numerical representation that the model forms when it processes inputs. By separating the cross-scenes feature from low-dimensional visualization, the researchers observed a clearer spatial structure in the middle layer of the model: circles, grids, and random layouts, all of which can be found in the extracted representation. This makes "how exactly does the model understand space" a question that can be directly observed and tested. This article has been recorded by NeruIPS 2026 as a spotlight paper.
Uncovering and Shaping the Latent Representation of 3D Scene Topology in Vision-Language Models
I'm not sure what I'm talking about.
The code link:https://github.com/pittisl/vlm-latent-shaping
Humans are often able to integrate a changing first-person view into a relatively stable cognitive map. Its core information includes three-dimensional position relationships such as "who is next to who" and "who is on which side of who". This paper calls the location between objects and adjacent structures a scene topology, and thus examines whether VLM also forms some form of internal representation that is not limited to a two-dimensional image grid.
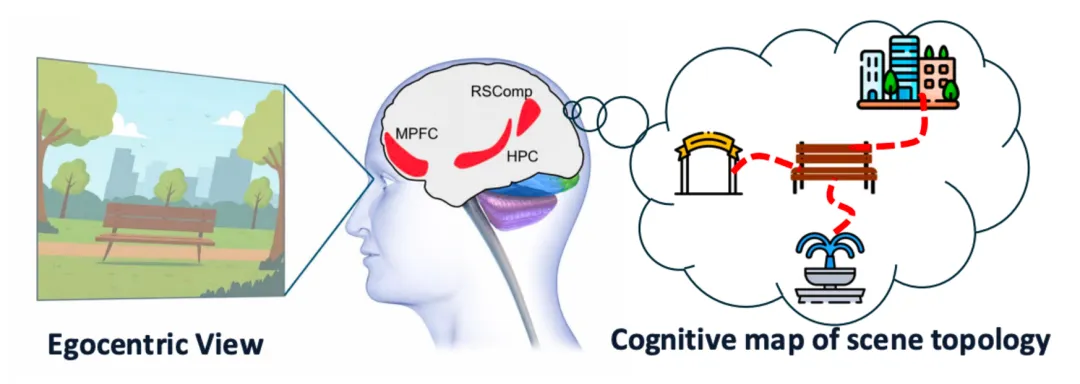
This problem is difficult to solve with the accuracy of the answers alone, as models may provide answers using object co-existence, language precedent, or other clues; attention maps show which image areas the model focuses on. They are not sufficient to answer whether the information of different objects constitutes a coherent three-dimensional structure within the modular network, and on which layers such a structure appears.
Preliminary results suggest that attributes such as color and shape are easier to read from a model's activation than from a three-dimensional position. Directly analyzing the original representation, it is often the first to see noticeable differences in appearance. Therefore, the key to the study is not merely finding spatial signals, but rather solving an explanatory question: how to separate the parts of concern when multiple visual information is mixed in the same set of high-dimensional representations of the model?
Introduction to methods
The paper's analysis process starts with object-level representations, first gathering scattered visual information, then removing stable identity attributes, and finally visualizing the remaining spatial structure.
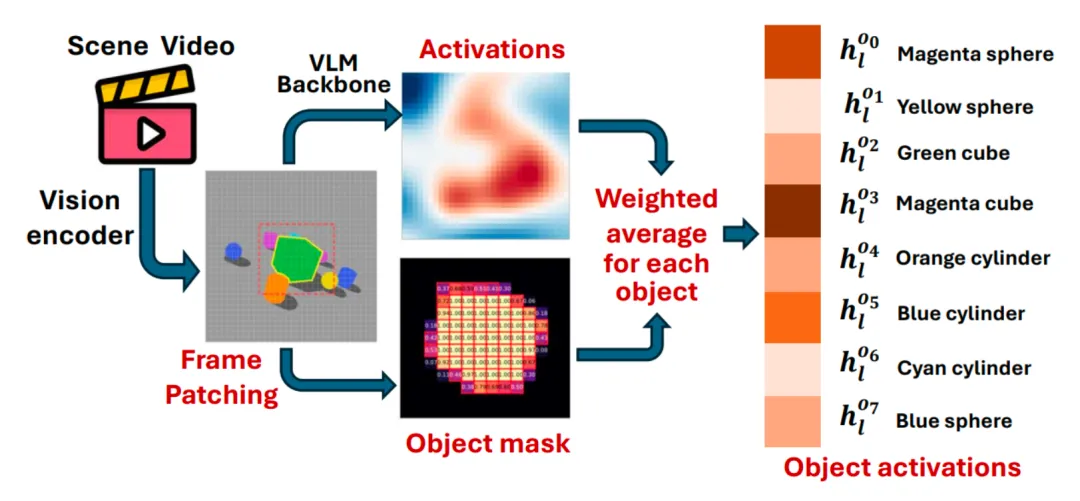
Step 1: Remove objects from visual markings
An object typically corresponds to several small pieces of images and appears in different frames of video. Research uses object masks provided by synthetic scenes to determine which visual tokens belong to the same object, weighted together by coverage ratio, and then averaged over time. Thus, each object in each scene receives a comparable activation vector.
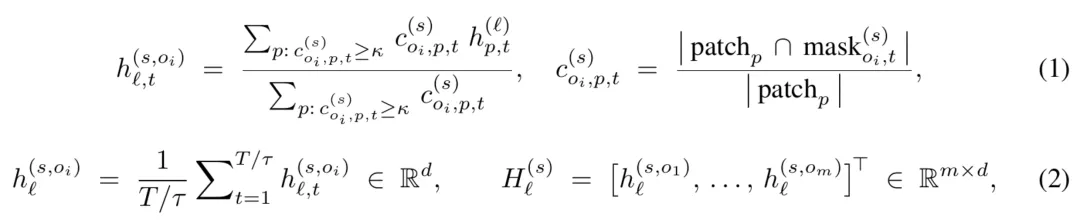
Here, l, s, o, respectively, represents the network layer, scene, and object. (1) The object is weighted by the ratio c and threshold κ in each time slot; (2) the object is weighted by the time average, and the object vector is stacked on a matrix H. This step transforms the objective of the analysis from scattered two-dimensional image blocks to objects, thus allowing further comparison of the relationship between objects, rather than merely observing local image characteristics.
Step 2 Identification and location separation using a cross-scenario average
It can be imagined that when the same "red square" is placed in a number of randomly generated scenes, its position changes constantly, but its color and shape remain consistent. Activation across its scenes takes the location components that can offset the changes on average and estimates these relatively stable identity attributes:

For multiple scenarios of the same identity object, the above equation asks for the mean. The right-hand side of the equation is followed by the identity component, the average space component, and the error item. The researchers use it to estimate the identity properties of an object, such as color and shape, with the assumption that the approximate linear decomposition, random layout, and spatial component averages zero.
Based on this, the study then explores the main directions of these properties in the cavity by decomposing the odd values and projecting the original expression quantitatively in these directions, thus retaining only the location-related changes:
Thus, the positive complement space that activates the projection into the identity attribute direction is added. In the above example, the column vector of W is the positive inverse of the attribute direction.
Step 3: Turn high-dimensional spatial signals into observable graphics
Next, the study uses main component analysis (PCA) to project the representation of the separated object in three main directions. Each point represents an object in a scene, and the arrangement between the points reflects the representation relationship within the model.
This is essentially an odd-valued decomposition of a separated representation matrix, where the first three rows of V are embedded in a three-dimensional PCA with Z. Each row of Z corresponds to an object in a scene used to observe structure, but not equivalent to real-world coordinates.
What does VLM hide space reveal?
The middle layer of the model presents a clearer three-dimensional scenario structure
The diagram below shows the various scenic layouts. The left side of each group is the actual object layout, with the right side representing the earlier, middle and later layers in the corresponding model. Compared to other layers, the representation of the middle layer extracted retains the scenic structure more clearly: the arrangement of the objects has a more pronounced correspondence to the neighboring relationship.
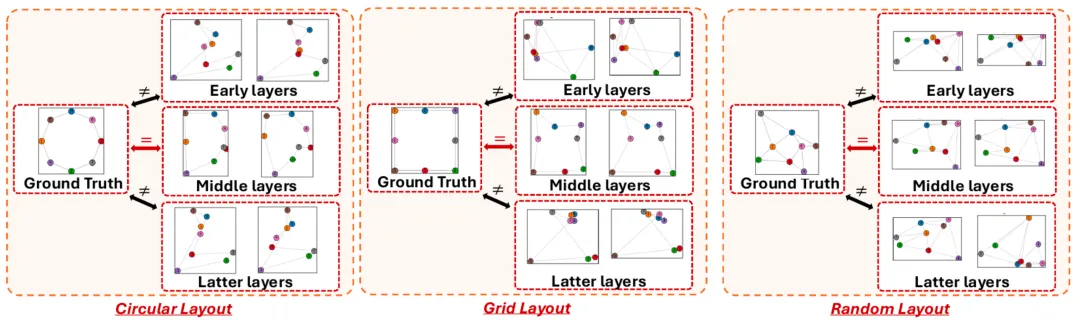
Figure 1 Visualizes the different layers of space in the middle layer more clearly corresponding to the real layout (original paper Figure 6)
These observed phenomena show that some spatial information is not visible enough in VLM's original activation and is easily seen after targeted separation. The value of visualization analysis lies in the fact that it transforms abstract vectors into verifiable relationship structures, allowing researchers to compare exactly which geometric information is retained in different layers. The authors thus propose an explanation for the VLM layer division: the earlier layers are more visually oriented, the intermediate layers are more prominent, and the later layers gradually serve the language output.
In addition to graphic similarities, neighbourhood relationships should be examined.
With only a few low-dimensional scattered dot charts, it is not enough to measure whether the internal structure is consistent with the real scene. The paper further uses the Dilichlet energy to examine an intuitive condition: whether adjacent objects in real three-dimensional space are also close to each other in hidden space.
Based on the three-dimensional distance of the object, the study established a Gaussian nuclear map to give the nearest object a greater connection weight; the energy would be higher if these objects differed greatly. The results were then compared with the baseline of the random disrupted object correspondence to obtain energy ratios for cross-layer analysis.
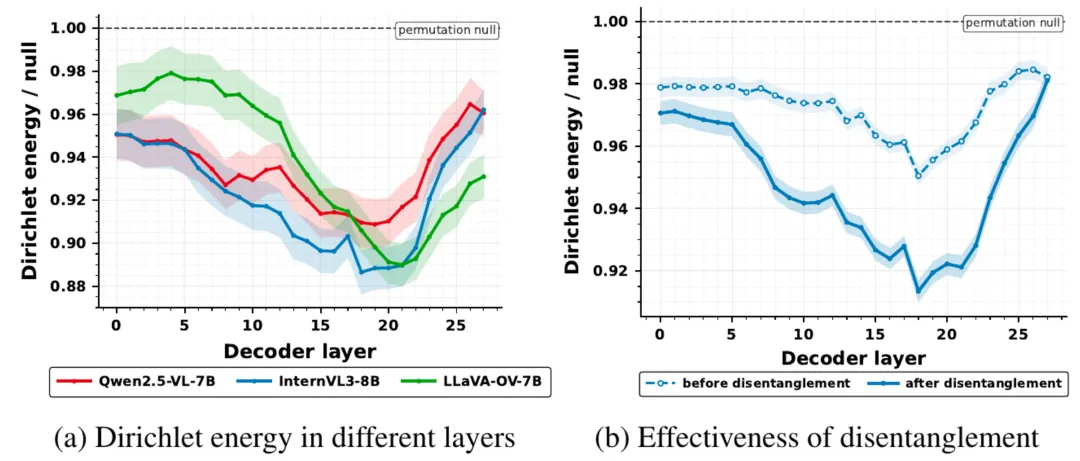
The results of experiments on the left-hand side of the diagram above show that the energy ratio of the middle layer is lower; the results on the right-hand side show that this trend is more apparent after the observed properties are excluded. Quantitative results and layout visualization are mutually valid, supporting the model's middle layer containing extractable scenario topology information.
The team further demonstrated that, under the condition that the representation retains sufficient differences and does not shrink, the representation of adjacent objects in real space is kept as close as possible, i.e. the Dirichlet energy is minimized. The optimum representation obtained after averaging and performing PCA presents a low-dimensional structure determined by the scene-neighborhood relationship, i.e. Laplace mapping, which connects the neighbourhood relationship to the PCA visualization (theorem 1). This provides a mathematical basis for the visualization of the hidden space: maintaining the neighbourhood relationship, which allows the internal representation to form several structures that can be interpreted.
How coordinate readings change after spatial directional interference
To further test the meaning of these directions, the team trained linear probes to activate predicting three-dimensional coordinates and to apply interference along a small-scale experiment along directions associated with a particular coordinate axis. At the same time, they added equal lengths, but the probes could not read the direction of contrast, comparing the effects of the two interferences.
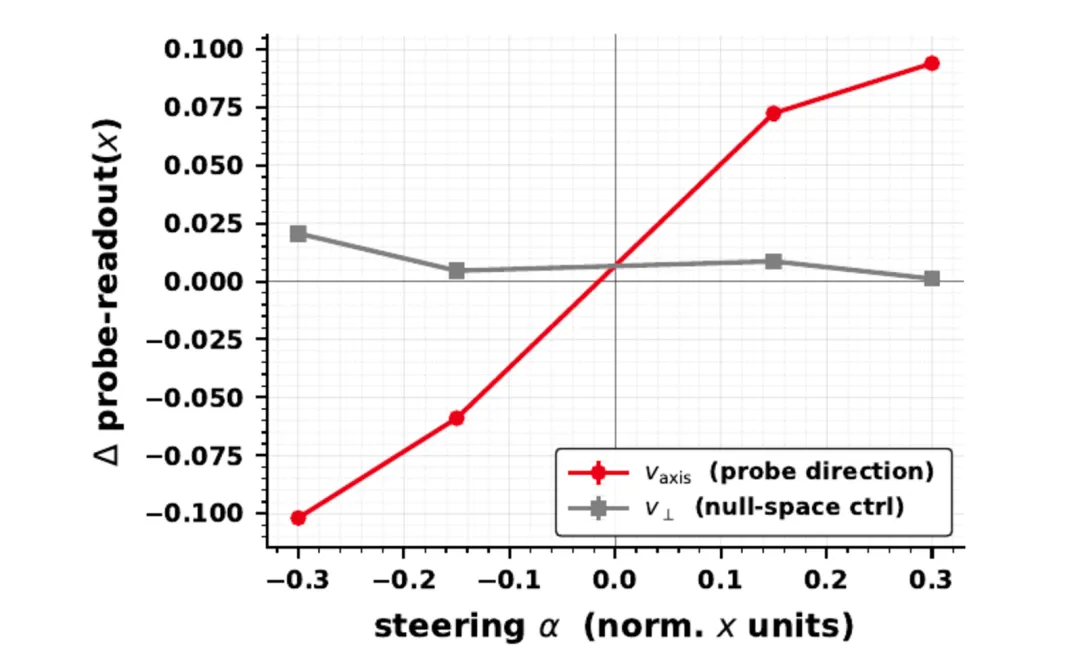
As shown in Figure 3, after positive-negative disturbance is applied along the direction of the space, the readings of the coordinate probe change directionally; no corresponding response occurs in the direction of contrast. This experiment examines the changes in the readings of the internal coordinate, providing additional evidence for the spatial meaning of the extracted direction.
From Symbolic Understanding to Improving Skills
As an extension of the characterization analysis, the team added Dirichlet energy to the mitigation target, provided training oversight with three-dimensional coordinates of synthetic scenarios, performed 500-step LoRA mitigation in the selected middle layer, and observed migration gains on the VSI-Bench and MindCube. For example, the accuracy of Qwen 2.5-VL-7B on simple relative directional missions on the VSI-Bench increased from 47.9% to 60.0% of the normal LoRA, an increase of 12.1 percentage points.
This result demonstrates that the analysis of internal structures can provide clues for training designs and can significantly improve the performance of existing VLMs in corresponding spatial understanding and reasoning tasks by reinforcing representations related to spatial position relationships in the model's stealth space.
Summary
The focus of this study is to make the three-dimensional structure in VLM hidden space observable, comparable, and testable. By separating external properties, displaying layouts, measuring neighborhood relationships, and conducting directed interventions, the study advanced the broader question of "does the model understand space" to a specific analysis of internal representations and provided tools for further studying the spatial cognition mechanisms of visual language models.

© THE