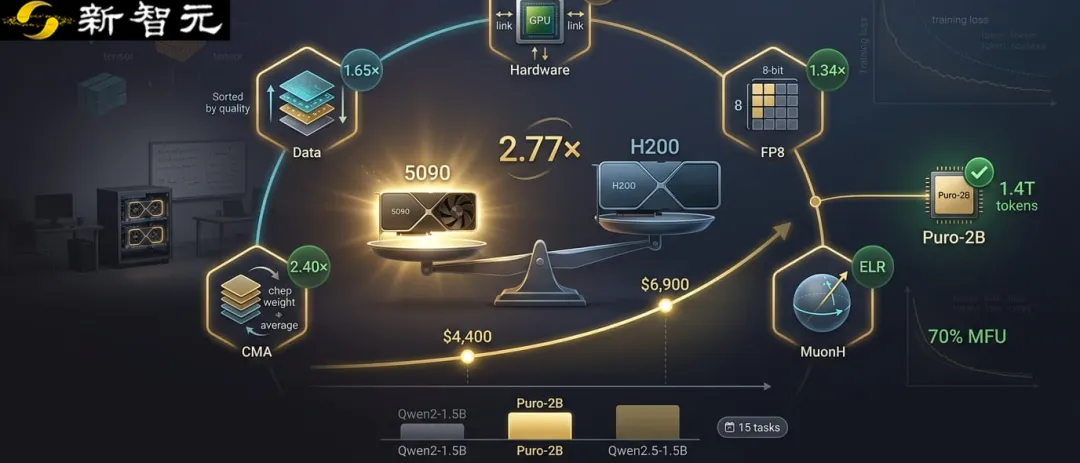
It's the first time in the history of the world.
I can't afford a 2.8T K3, I can't afford a 124M nanoGPT and I want to try it.A billion parameters, trillions of tokens pre-trainedHow high is the threshold?
These models are widely used, such as the classic Qwen series ((Qwen2-1.5B, Qwen2.5B, Qwen3-1.7B...)).
However, the Qwen series, despite the open-source weight, has not fully disclosed the pre-training formula. Further open-source data and training details, such as OLMo, SmolLM and others, are still expensive to replicate: it is estimated that the computational costs required to replicate OLMoE-1B/7B and SmolLM3-3B, even with only one billion parameters, are approximately $200,000.$200,000 and $719,000。
For ordinary laboratories, it's not enough to know "how to train", but it's really "how to train".Low-cost, reproducible "Poor Edition" pre-training program。
Puro-2BThe "Poor Edition" pre-training program is open-source throughout the process
To address this issue, Chen Chen and his team at Tsinghua University have launched an open-source approach to the whole process.It's the first time that I've ever heard of a Puro-2B.Open source training data, training frameworks, training configurations and model weighting.
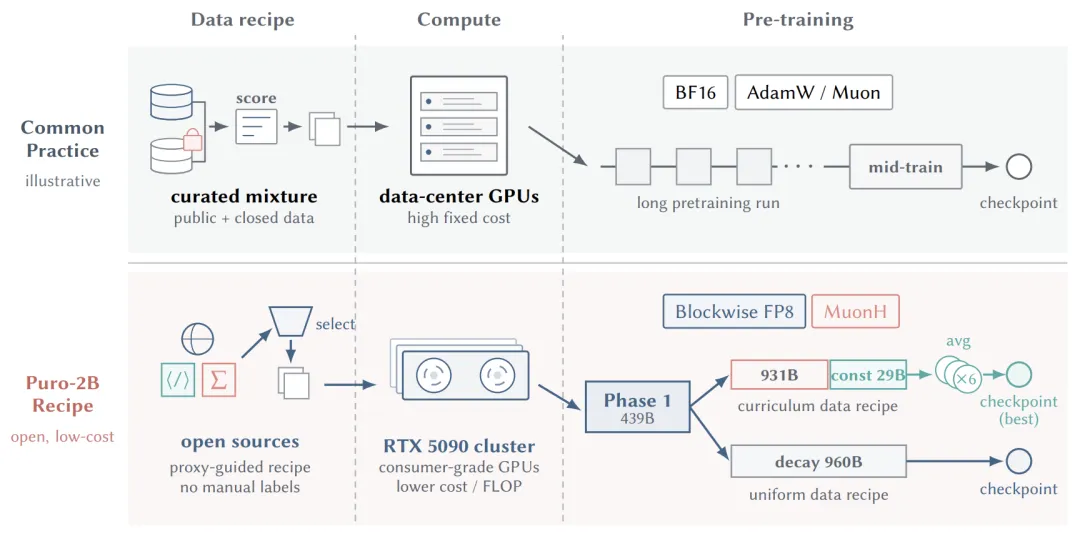
Puro-2B is the poor version of the training process.
They trained about 2 billion parameters from scratch on the computing cluster of consumer-grade graphics cards RTX 5090, using a maximum of 1.4 trillion tokens.
In a comprehensive assessment covering 15 missions, based on this scheme,With a pre-training calculation cost of about $4,400, the model exceeded Qwen2-1.5B on 15 mission averages.。The best version cost $6900, with average performance close to Qwen 2.5-1.5B.In comparison to other open-source programs, Puro-2B significantly reduced training costs.

Link to the paper:https://arxiv.org/pdf/2608.27370
Open source materials gathered:
Models and intermediate checkpoints:https://huggingface.co/collections/thu-pacman/puro-2b
Training dataCompared to:
Training code:https://github.com/thu-pacman/Puro-Megatron
Data processing code:https://github.com/thu-pacman/Kaiyuan-Spark
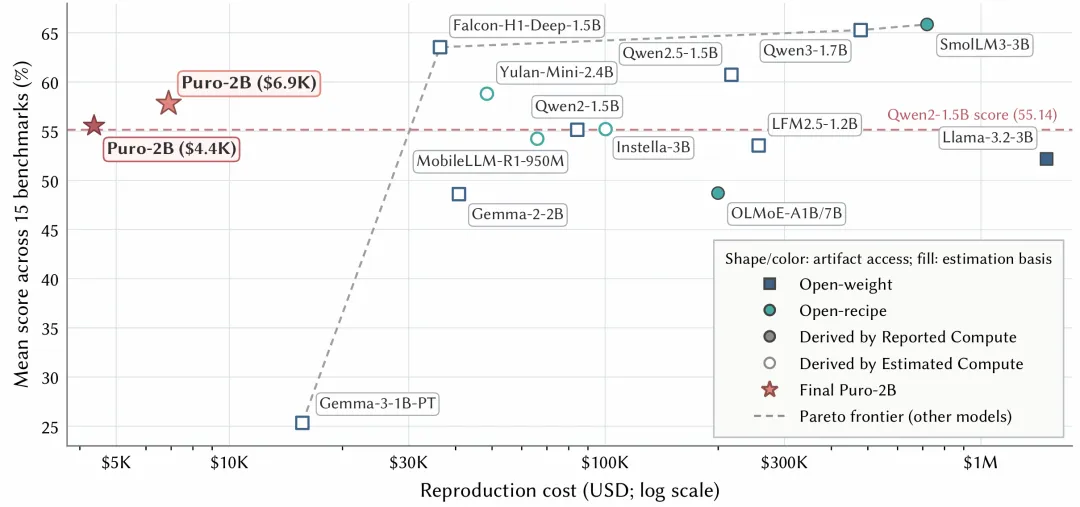
Figure 1 Model performance and cost of reproduction
If the budget is smaller, what level of training will the models be able to achieve?Curve of the Performance Experience of Cost Scaling (Puro Cost Scaling Law)It is used to estimate the level of training of models under different budgets.
Starting from the same first-stage training checkpoint, they adjusted the training budget for the second-stage uniform data formula to match the ratio of average performance scores to total costs.
This curve of experience for the Puro training program allows researchers to estimate the level of capability that different budget costs can achieve before formal training, and to combine the need-adjusted training program without having to repeat the longest model training process.
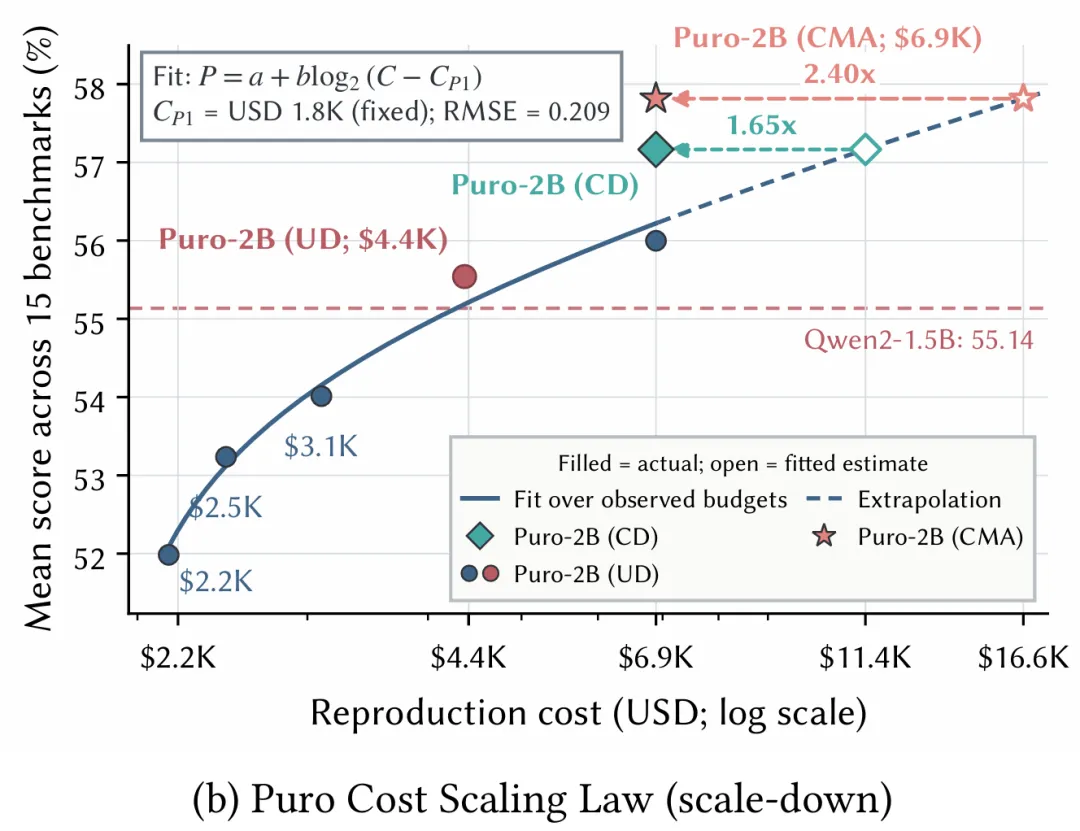
Figure 2b of the Pure Cost Scaling Law
This is a low-cost program that comes fromFrom hardware selection, low-precision training, optimizer improvement, high-quality data utilization efficiency, data selection to collaborative design of these five parts.
Unit cost, higher computing power
Compared to other open-source training programs, the Puro-2B team started from a more basic, more underlying, and closer to real-world problem:
How many calculators can the same budget buy?
Calculated by the paper's GPU rental price, they found that the RFX 5090's BF16 peak computing power/USD was about H200.2.77 times. This means that the unit cost of RTX 5090 is more computational than the widely used data center card.At the same time, the RTX5090 as a consumer-grade graphics card is also compatible with the availability of hardware.
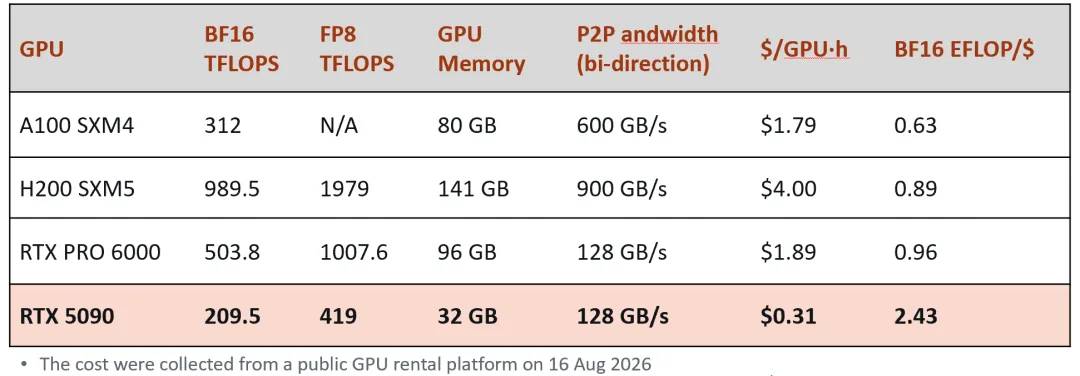
Paper Table 2 simplifies statistics and comparisons of calculation price ratios for different graphics cards
However, the RTX 5090 has only 32GB of display storage and no NVLink, so it is not possible to directly view the training configuration of the data center GPU.
The Puro-2B team enabled PCIe P2P communication within the nodes through drive and system configuration adjustments, changing the single-way bandwidth between GPUs from 31.5.GB/sUpgraded to56GB/sCommunication delay decreased from 14.3 μs to0.4µs;
Inter-node GPU Direct RDMA is enabled to increase the 24-car AllReduce broadband bandwidth from 8.87GB/s.19.93GB/s。
Puro's training strategy has also been optimized for the hardware characteristics of the RTX5090 with a multibillion-parameter computing load: they combine data in parallel with flow streams to avoid frequent voltage parallel communications;
By re-allocating the calculation of each phase of the flow line, adjusting the size of the micro batches and balancing the state of the optimizer according to the status of the cache occupancy, balancing the cache load of the different nodes.
It's a great way to improve your business.The overall MFU is over 70%.The benefits of converting the price of consumer cards to training costs through these engineering adaptations and system optimization.
With more calculation power, the next step is to improve computational accuracy.
FP8 takes advantage of the RTX 5090's low precision efficiency
RTX 5090's Blackwell architecture also provided the basis for FP8 training. They followed DeepSeek-V3's finite-particle block quantification approach, placing the matrix multiplication of the main linear layers on the FP8 path, while keeping the numerically sensitive operation and training state BF16 or FP32 accurate.
In order to determine whether or not to calculate, they verified the net efficiency gains from FP8 training through scaling ladders, a control experiment of different model sizes.
Through five model-scale experimental controls, they found that the validation losses of FP8 were about the same as those of BF16.0.0031—0.0039However, the gap is smaller and stable across scales.
At the same time, the training throughput of FP8 has been achieved.1.36 timesImproved; it is estimated that after calculating the accuracy loss deduction for the additional calculations required to achieve the same loss, approximatelyNet efficiency gains by 1.34 times。
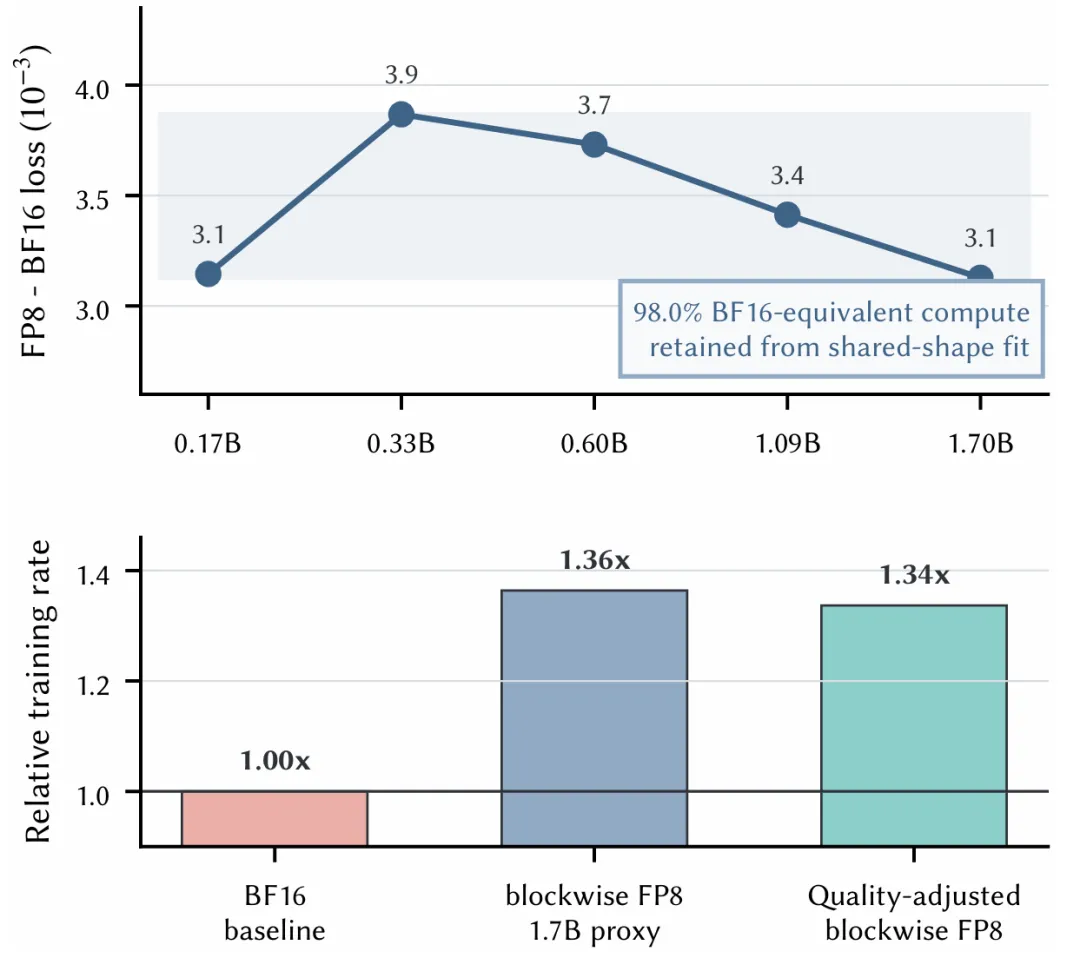
Paper Figure 10b The loss gap of FP8 and efficiency after quality correction
From ordinary learning to effective learning
After determining the accuracy of the calculation, how the optimizer design and the learning rate will affect the effect of each step update. The optimizer determines the direction of each step update and the learning rate determines the length of each step update.
They adopted the emerging MuonH optimizer: they standardized the amount of weight updates based on Muon, and after the weight updates, they projected the weight back to a fixed radius, thus controlling both the update spectrum and the weight spectrum.
In this way, we measure the relative weights of the updates.It is also important to note that there are a number of ways in which learning is effective.It can be explicitly pre-set without being indirectly drifted along with weight measurement changes during training.
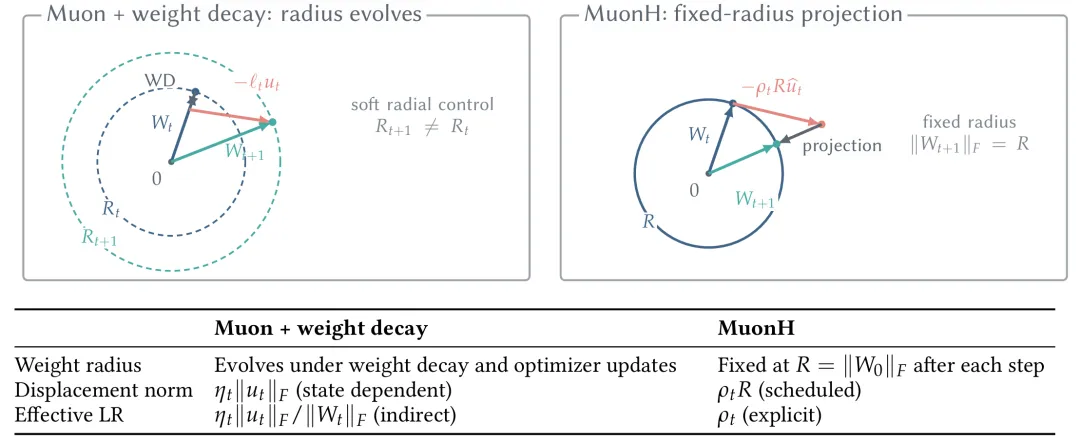
Figure 4 illustrates the principles of Muon and comparisons with Muon.
Their key observations came from a set of controlling experiments: using ordinary Muon to make weight projections without a fixed radius, and only by dynamically adjusting the learning rate to align the ELR trajectory of the training process with the MuonH, the loss curve almost coincides.
This shows that the advantages of MuonH in reality cannot be attributed solely to the parametric constraints.The process of changing the effective learning rate of ELR is an important clue to understanding the effectiveness of superball optimization.。
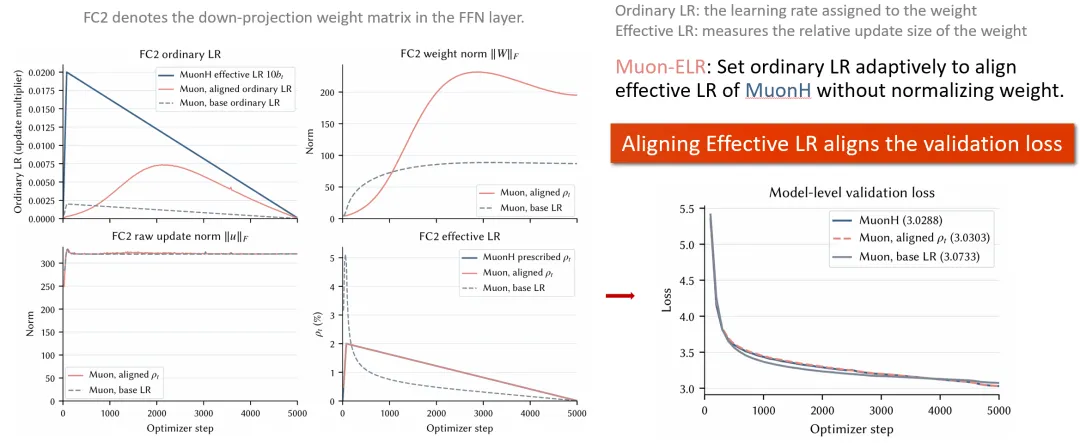
Comprehensive paper Interpretation and contrast of Figure 5 in line with the Figure 15 ELR experiment
Further comparison found that the ELR of ordinary Muon optimizers decreased more rapidly and losses decreased earlier when weight decay was not limited to the weight range; MuonH maintained a slower decline and performed better later.
This has led them to shift their attention from "which optimizer to use" to "how to design a more rational and effective learning rate scheduling (ELR schedule)".
Subsequently, they diluted the ratio of peak learning rates and training data for the decline phase of training. The results showed that higher peak learning rates and longer training cycles typically require longer decline processes.
Therefore, in the first stage of their training, they use a method that does not rely on a predetermined endpoint.power scheduleSupporting continuous training; Phase 2 adoptionLong-range declineThis is the only way to save money and make room for the final loss.
A comparison based on the Scaling Ladder further demonstrates that the training efficiency of the MuonH scheme is approximately the same as that of the modified Muon baseline.1.19 times。
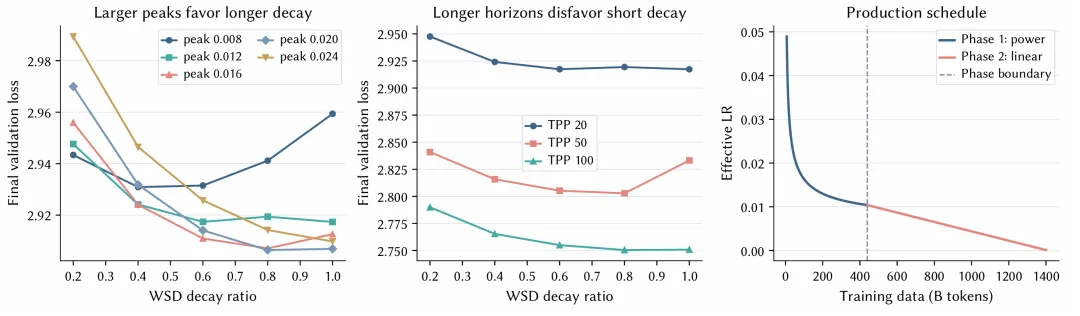
Paper Figure 6 How to design learning rates
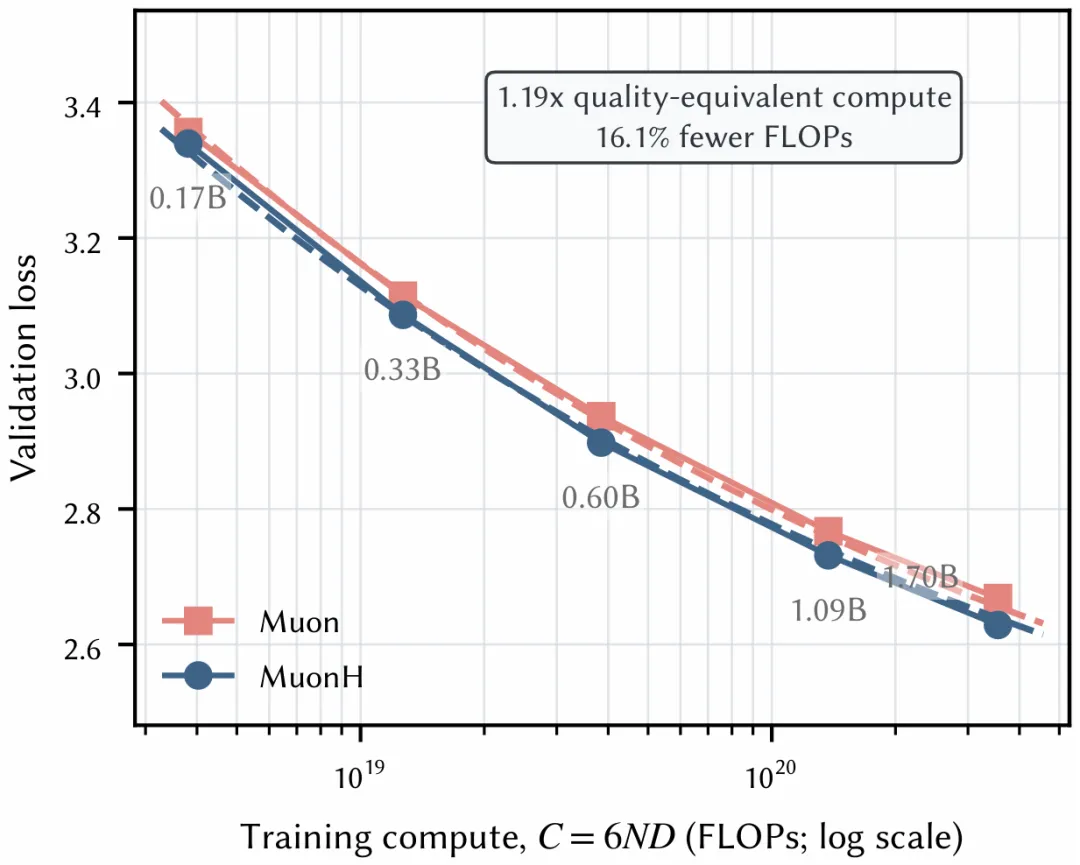
Paper Figure 10a The effectiveness of training in MuonH is melting
Put the good data back into the training.And let the model learn how to get in.
In addition to optimizers, data efficiency is also influenced by data deployment. High-quality data is not high in the training data set but plays a key role in helping to improve utilization efficiency. Many open-source data gatherings simultaneously provide quality scores for samples.
The Puro team used these signals to line up higher-quality samples within each data source into the post-training phase and then align the data blocks of different sources according to the training progression.
This allows the data set to move gradually to areas of higher quality during the training process and keeps the data set composition of local training areas more stable than approximate, avoiding changes in quality while causing a mutation in the proportion of field data.
However, the data is in good order and does not mean that the model can be fully learned.After trainingRate of learningWhen too low, the final quality data is difficult to push parameters up to date.And that's what they did.Curriculum Model Averaging (CMA)Maintaining a constant learning rate at the end of the training period allows the model to continue to learn high-quality data and then weight average the checkpoints at the end to mitigate the training noise resulting from higher learning rates.
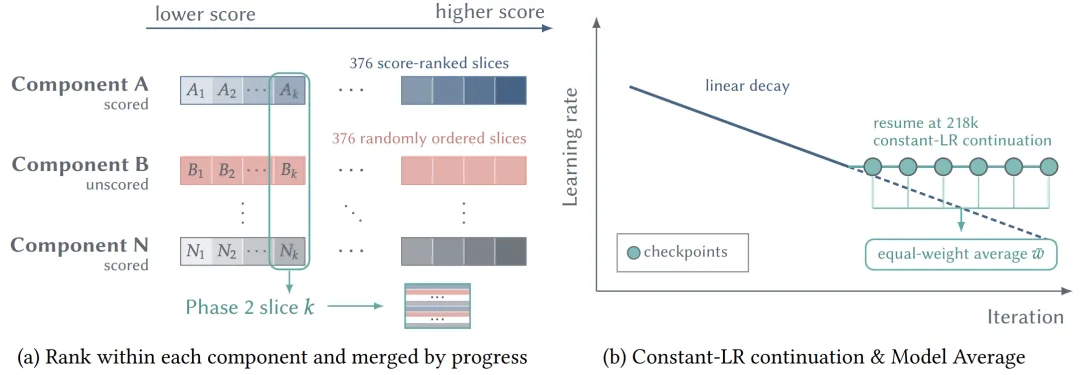
Figure 7 compares the average of the data-constructing model with the data-constructing model.
Further dilution also shows that modeling averages directly on the training trajectory of declining learning rates will not stabilize the benefits.What really needs to be combined is the sequence of data, the rate of late learning and the average model strategy.
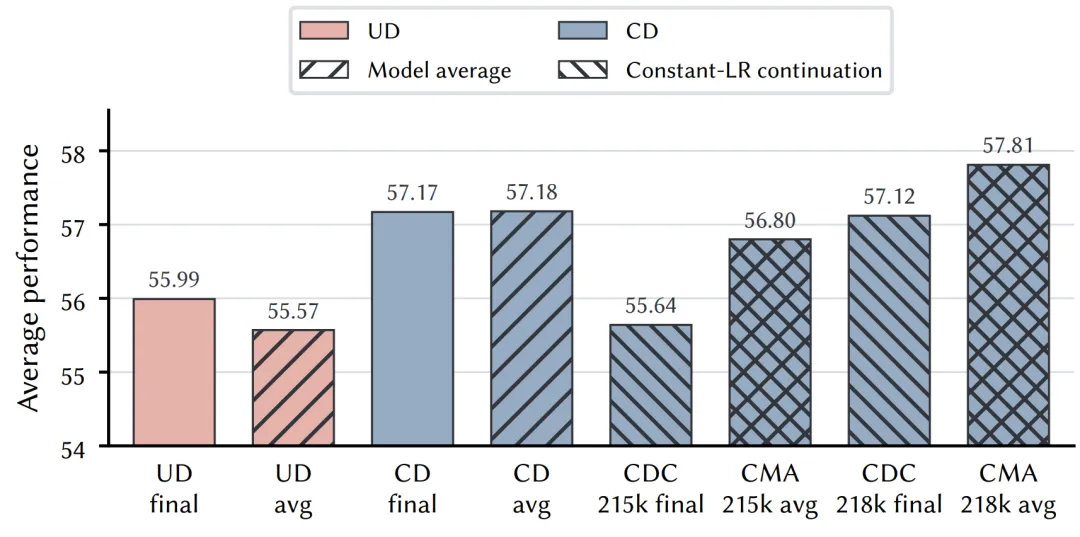
Figure 13b illustrates the fusion of data sequencing, later learning rates and model average strategies.
According to the Pure Cost Scaling Law, a decrease in the learning rate of a data course would be equivalent to a cost-efficiency increase of about 1.65 times, compared to a random data deployment of Uniform, UD.2.40 times。
Assessment of data
After the sequence of data is resolved, it is also decided which data to select.
They set up a "Assessment of the ability to filter data from data sourcesFor large-scale and scored datasets, separate data slices are extracted from different scores;
Other eligible data sources use random cutouts. Each candidate cutout starts from the same checkpoint, continues training under the same training configuration, and receives a multi-dimensional demonstration of mathematical, coding, Chinese, and general ability with fixed ratings.
This can both compare different data sources and reveal quality differences within the same data source. Small-scale alternative experiments (proxy experiments) also show that in comparison to mathematical capabilities, coding capabilities are more impaired than general capabilities.
Accordingly, they improved the proportion of mathematical data appropriately in the second phase, while combining field coverage and quality screening to determine the final ratio.
These small-scale experiments provide a reference to "which data to select, which scores to retain, how much proportion to allocate to different sources", and the results of the data set evaluation are also made public in the report.
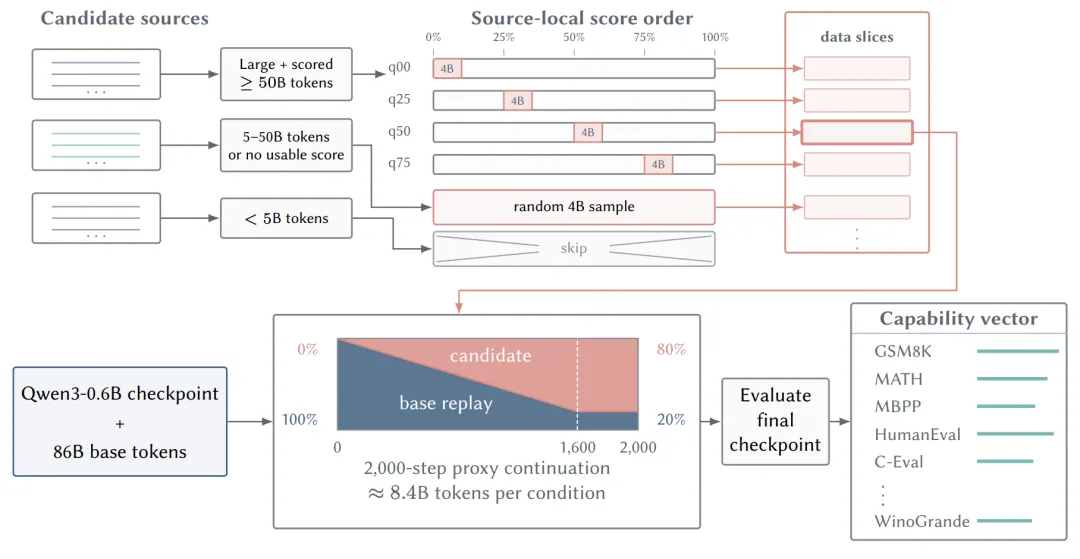
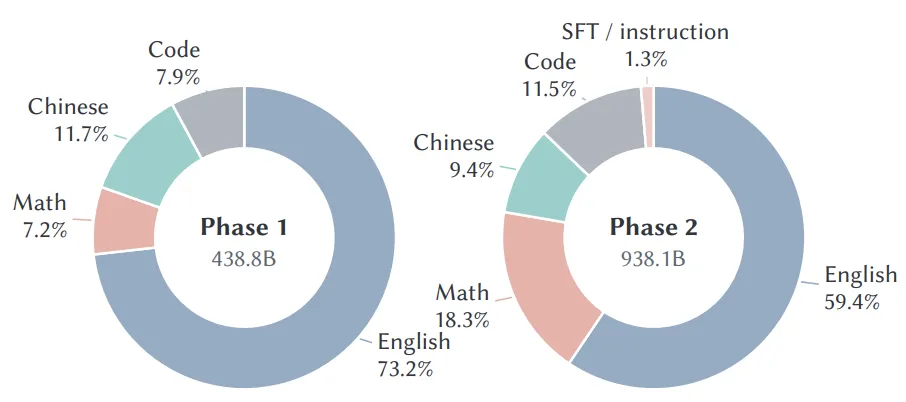
Paper Figure 9; F: Representative evaluation process Figure 8: two-phase data comparison
From saving computing to covering training processes
Looking back at the whole package, there are different levels of efficiency issues that are addressed at different levels:Hardware reduces the cost of computing per unit, FP8 increases computing peak to shorten execution time, and MuonH improvesLossesValue convergence rate, increase in CMATraining dataThe use-efficiency of proxy evaluation helps to select data that is more worthy of training.These improvements together make up Puro's low-cost training process.
Figure 2a Summary of efficiency gains from each link
For example, researchers can control the pre-training process and then test the results of the training.
Here's an example:Researchers are often concerned about improvements in pre-training methods and whether they will be effective after training.With only open-source weight, researchers find it difficult to control the model's previous pre-training process; while the Puro-2B allows modifying the pre-training method, continuing to fine-tune, and testing the end result to be an operational and cost-effective experimental process.
Puro's team used the same dilution process for the two pre-training weights of CMA and Uniform. In the two sets of mathematical ability dilution experiments, the accuracy of GSM8K based on CMA initialized dilution was higher, respectively.1.77 and 2.02 percentage points• 15 benchmark averages improved in the Tulu-3 mixed-domain mitigation1.17 pointsIFEval increased1.36 points。
All three control groups showed overall improvements, indicating that the advantages of CMA as a whole can be extended to post-training. Consequently, the Puro-2B offers not only a higher-scoring model, but also a set of pre-training baseline processes for testing whether pre-training methods can yield final benefits.
Paper Figure 11 CMA compares the weight of the Uniform data with the pre-training weight of the Uniform data.
The Puro-2B Pro model, the name of which seems to be related to the Pro crowd, is it going to be a model manufacturer who is going crazy on a scale-scaling path, or is model training gradually becoming part of the Pro crowd's reach?