The authors of this article are from the Hong Kong University of Technology and byte jump. The first co-author, Xu Wenqiang, is from the Hong Kong University of Technology. Xu Wenqiang is a PhD student at the Hong Kong University of Technology.
This is what text-to-vis does: users say what they want to see, the system goes to the curry and then graphs to show the data they need.
You might think that the big model is already very strong, but it's a small thing. The model is strong, and it's necessary to be clear. Usually, most users are not able to fully express their needs at once. For example, "draw out the monthly revenues of the top 5 products in 2025 and dismantle them by region", sounds very specific, can the top 5 by sales volume or by sales, refunds are not counted, there is no 2025 data in the database, these are not yet.
So, to get data visualization that matches the real intentions of the user, it often requires multiple rounds of interaction between the model and the user: missing additions, vague clarifications, incorrect changes, step-by-step falling to the image that you really want to see. This is also the research background of this work. From a practical point of view, this scenario is solved by checks and drawings in real business.
Once "demand is often said to be incomplete" as a prerequisite, existing research encounters two challenges simultaneously. First, most existing benchmark datasets assume that queries are already clear, and it is difficult to evaluate open visual output, i.e. in the same sentence, there is often more than one rational drawing method. Second, existing methods have not been able to actively ask users' true intentions back through dynamic interaction.
To address these two challenges, the research team proposed:VisInteractThis is a dynamic interactive Text-to-Vis paradigm for imperfect queries. To achieve this paradigm, the team released a benchmark for evaluation.VisInteract-BenchRecognizing that inputs can be vague, missing information, or even wrong, while also offering a method based on Monte Carlo tree search.Vis-MCTSFor the system to split and go back and forth between checking, drawing, and questioning, it returns the real intent of the question.
Currently, the work has been accepted by NeurIPS 2026 as Spotlight (posted 292/30709).
The title of the paper is: VisInteract: Towards Dynamic Interactive Text-to-Visualization under Imperfect Queries
Address of the paper:https://arxiv.org/abs/2609.15182
Code address:https://github.com/wxxv/VisInteract
Background of research
Studies have been conducted to answer the following questions: in the methodology, Text-to-Vis translates data visualization from natural language to Vega-Lite, goes from large models to writing code, and then to multi-smart body flows; in the evaluation, NVBench, VisEval, MultiVis-Bench and other criteria have expanded samples from thousands to tens of thousands.
In the paper, there is a more specific example of interaction. Users want to use cookie charts to exclude the 15 counties with the most K-12 enrollments in California and specify the number for 2025. The database does not have data for 2025, and users do not really want cookie charts, but columnar charts by area, from large to small.
Challenge one: existing benchmarks do not depict imperfect inputs and it is difficult to evaluate open outputs.At the input end, real queries often involve ambiguity, lack of information, or fact errors, but the existing benchmarks are mostly single-choice, or provide only pre-written static feedback. The adjacent Text-to-SQL domain has begun to make dynamic clarifications, while Text-to-Vis lacks a correspondence benchmark, and it also requires additional processing to look at the feedback. The output end is equally blurry: the results concentrate incorrectness on at least one relatively clean scale; however, in Text-to-Vis, the same sentence's intent, column diagrams, curvature diagrams, and color mapping can often be "an exact one".
Challenge 2: Existing methods cannot actively retrieve user intent through dynamic interaction.It is difficult to get back from the wrong assumptions at the beginning, to systematically explore the design space, and ultimately not to get what the user really wants to see.
These are the two gaps that VisInteract needs to fill: admitting that the input is imperfect; admitting that the output is open; admitting that the method can be forked; admitting that it can be reversed rather than a path to blackness.
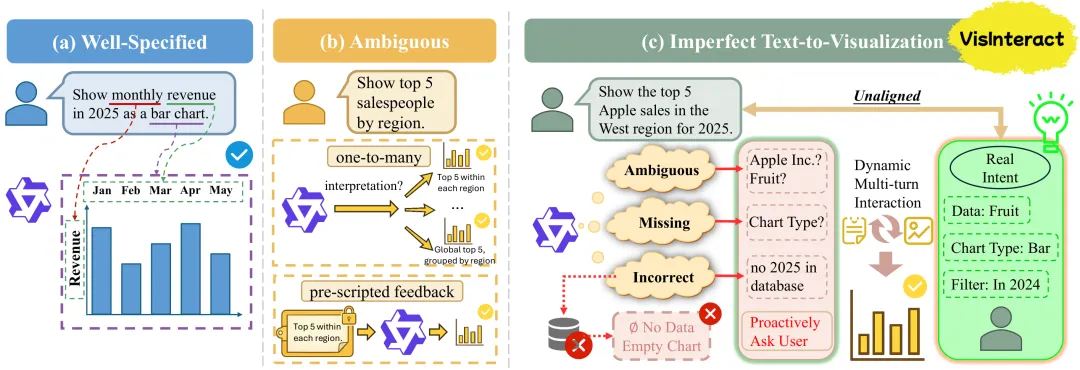
Figure 1: Three Text-to-Vis paradigm contrasts. The left-hand default query has been cleared, with only one trajectory mapped in the middle; while VisInteract has repeatedly interacted with the real intent in incomplete queries.
Building benchmarks
In response to the first challenge, the paper published the VisInteract-Bench. This is known to be the first benchmark for dynamic interactive Text-to-Vis: 1098 article samples, 11 databases, 75 spreadsheets, covering 7 areas of sports, entertainment, education, finance, medicine, etc. Each sample has an average of about 4.7 key features. The input is purposely injected at the same time as incomplete natural language queries, about 61% of the samples are biased, 69% are factual errors; the interface is rotational and modular, and will follow changes in system output, as well as previously written scripts.
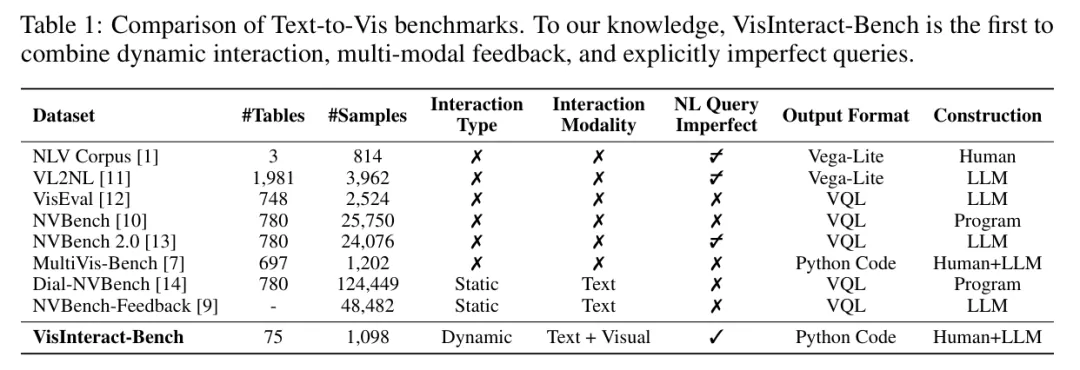
Table 1: There is a text-to-vis benchmark contrast. The VisInteract-Bench covers dynamic interaction, multi-modal feedback and imperfect queries at the same time.
VisInteract-Bench also designed User Agent to simulate users. It knows the standard answers, including key features, reference codes, and reference charts, but does not actively cross-reference; the system will refuse if it directly requests intent.
The output end of the evaluation is based on LLM-as-Judge's dual point of view assessment. The code referee checks whether each key characteristic is met and the graph referee checks whether the rendering results meet each key characteristic. The main indicator is Task Score: all the key characteristics of a sample are met and the task is completed. The design of the evaluation is to see whether the key characteristics are met, rather than whether the results are generated in the same way as the reference graph model, ensuring the openness of a Text-to-Vis evaluation.
Core Methods
To address the second challenge, VisInteract modeled dynamic interactive Text-to-Vis into a partly observable sequential decision making: the system could see imperfect queries and databases, but could not see the real intent of the user, and could only get indirect evidence through text queries and viewing chart feedback.
First, the legal way to go is infinite: a step can be any SQL, a piece of drawing code, or a natural language problem, opening all the children's nodes, and the tree will explode at the first step. Second, the words asked cannot only serve one path: each path in the classical search is asked, and the same phrase "in sales order" can be repeatedly used up.
The overall framework of Vis-MCTS consists mainly of three parts, corresponding to the three walls respectively. The first part is a gradual enlargement of the selection and extension. The system branches between checking SQL, drawing Altair diagrams, asking users and ending these four types of actions; the more access to a node, the more multiple branches are allowed to grow, and a hard limit is set. At the same time, the diversity of hints and weighting is used to avoid repeating the same code in the same context. The second part is the simulation of path memory.
One example in the paper is the user feedback, "I want a columnar graph from large to small in area", with only 2 points of satisfaction. After disassembly, the data dimension is 10 points, the graph design is 3 points, and the intent is 2 points. The checking step gets higher returns, the drawing error type is pressed down separately. If uniformly reversed, all three steps get the same low score, and the correct SQL is dragged down by the wrong graph.
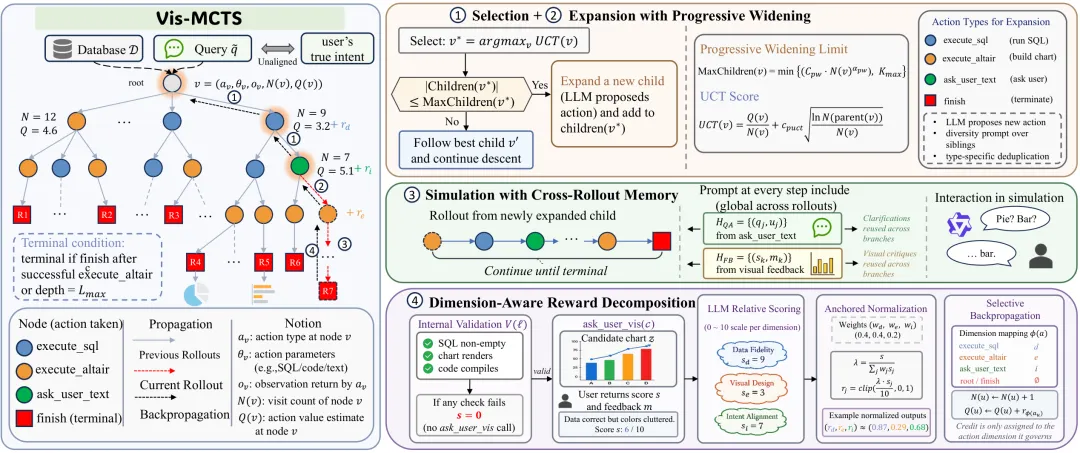
Figure 2: Overview of the Vis-MCTS method. Searches are split between checks, drawings and queries, feedback is shared across routes, and scores are retransmitted according to data, design and intent.
The results of the experiment
The paper evaluated Vis-MCTS on the VisInteract-Bench, using Qwen 3.5 flash and Gemini 3.1 flash-lite-preview, respectively. The controls included both Self-Correction LLM and nvAgent methods that do not interact with users, ReAct, Best-of-N ReAct, and MultiVis-Agent methods that interact with each other.
The results showed that Vis-MCTS scored best on both skeletons, as well as code, graphs, and merges, with 100% rendering and a very stable overall performance.
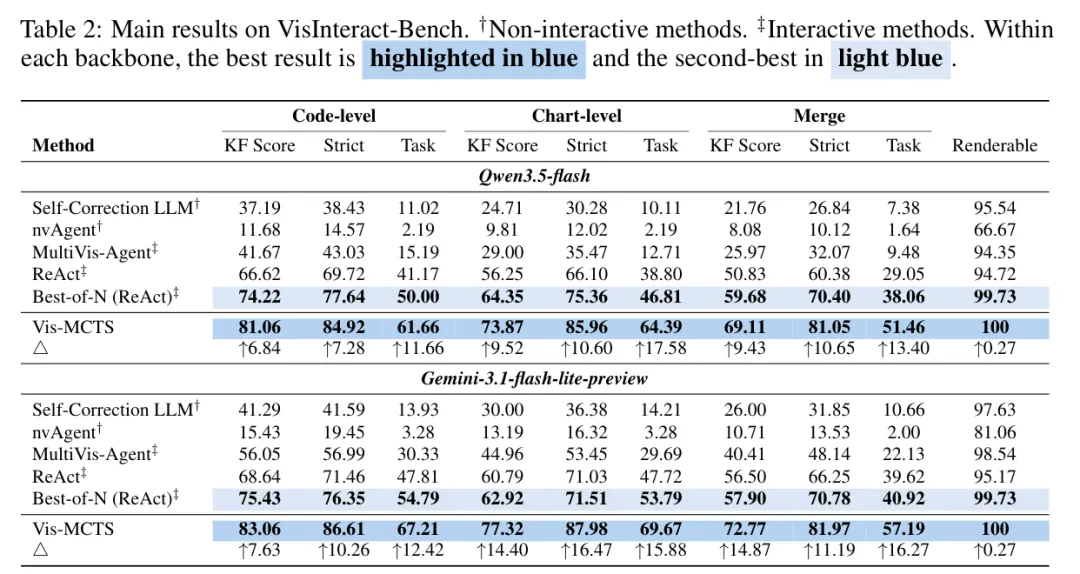
Table 2: Results of the main experiments on the VisInteract-Bench.
Specifically, on the strictest Merge Task Score, where all key characteristics of code and graphs must be met, Vis-MCTS reached 51.46 percent on Qwen and 57.19 percent on Gemini. The best-of-N interaction baseline was 13.40 percent and 16.27 percent, respectively; the relatively non-interacting self-correcting error was 7.38 percent and 10.66 percent; the task success rate was more than five times higher. The Task Score from a code perspective also rose from 50.00 percent to 54.79 percent of the strongest baseline to 61.66 percent and 67.21 percent.
The same 10 budgets, running 10 links at a time, yields are unstable: Best-of-N on Qwen is about 9% higher than single ReAct, and only about 1.3% higher on Gemini.
The dissolution experiments in the paper also support the effectiveness of this design. In Qwen's Merge Task Score, for example, the complete model is 51.46%; once visual feedback is removed, the score drops to 24.24%, the most noticeable decrease because the search loses the terminal signal; cross-path memory is removed at 34.06%; reward decomposition is removed at 43.26%; text queries are removed at 44.08%. This shows that the enhancement of Vis-MCTS does not come from a single technique, but from the synergy of the whole mechanism of "differentiated regression + interaction sharing + erroneous retransmission".
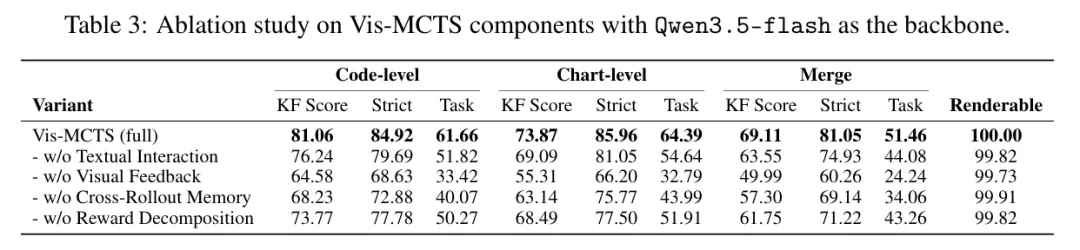
Table 3: The Vis-MCTS modules are dissolved (the skeleton is Qwen 3.5 flash).
Because the evaluation used large model arbitrators, the paper also performed cross-validation: replacing a large model family of GPT arbitrators with artificial experts. As shown, two of Cohen's Kappa and the three's Fleiss' Kappa crossed the "almost perfectly consistent" line of 0.81.
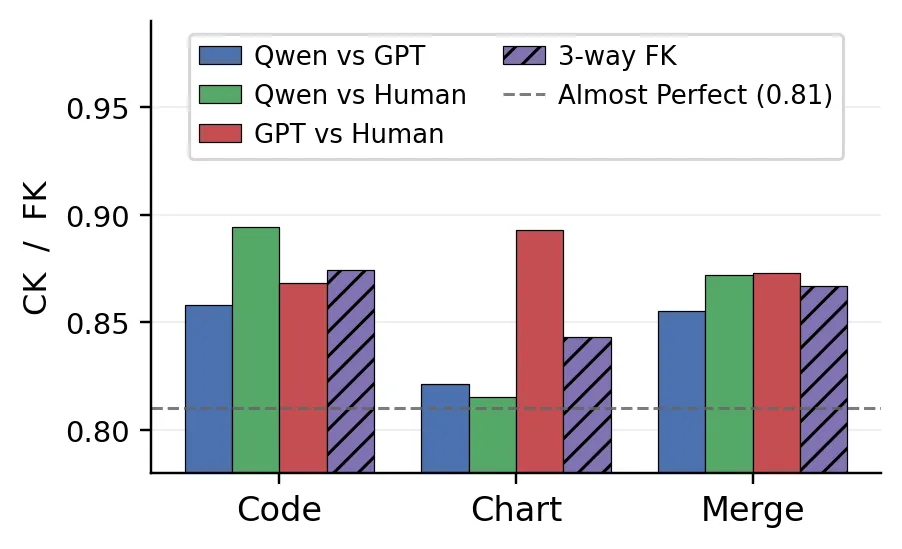
Figure 3: Arbitration consistency. Two Cohen's Kappa and three Fleiss' Kappa are greater than 0.81.
The following is an example of an interaction with Vis-MCTS. In the face of imperfect queries with simultaneous factual errors and non-matching graph types, the system is gradually converging through questioning and viewing graph feedback, and the dimensional-perceived reward decomposition only single-handedly suppresses that step of the graph error.
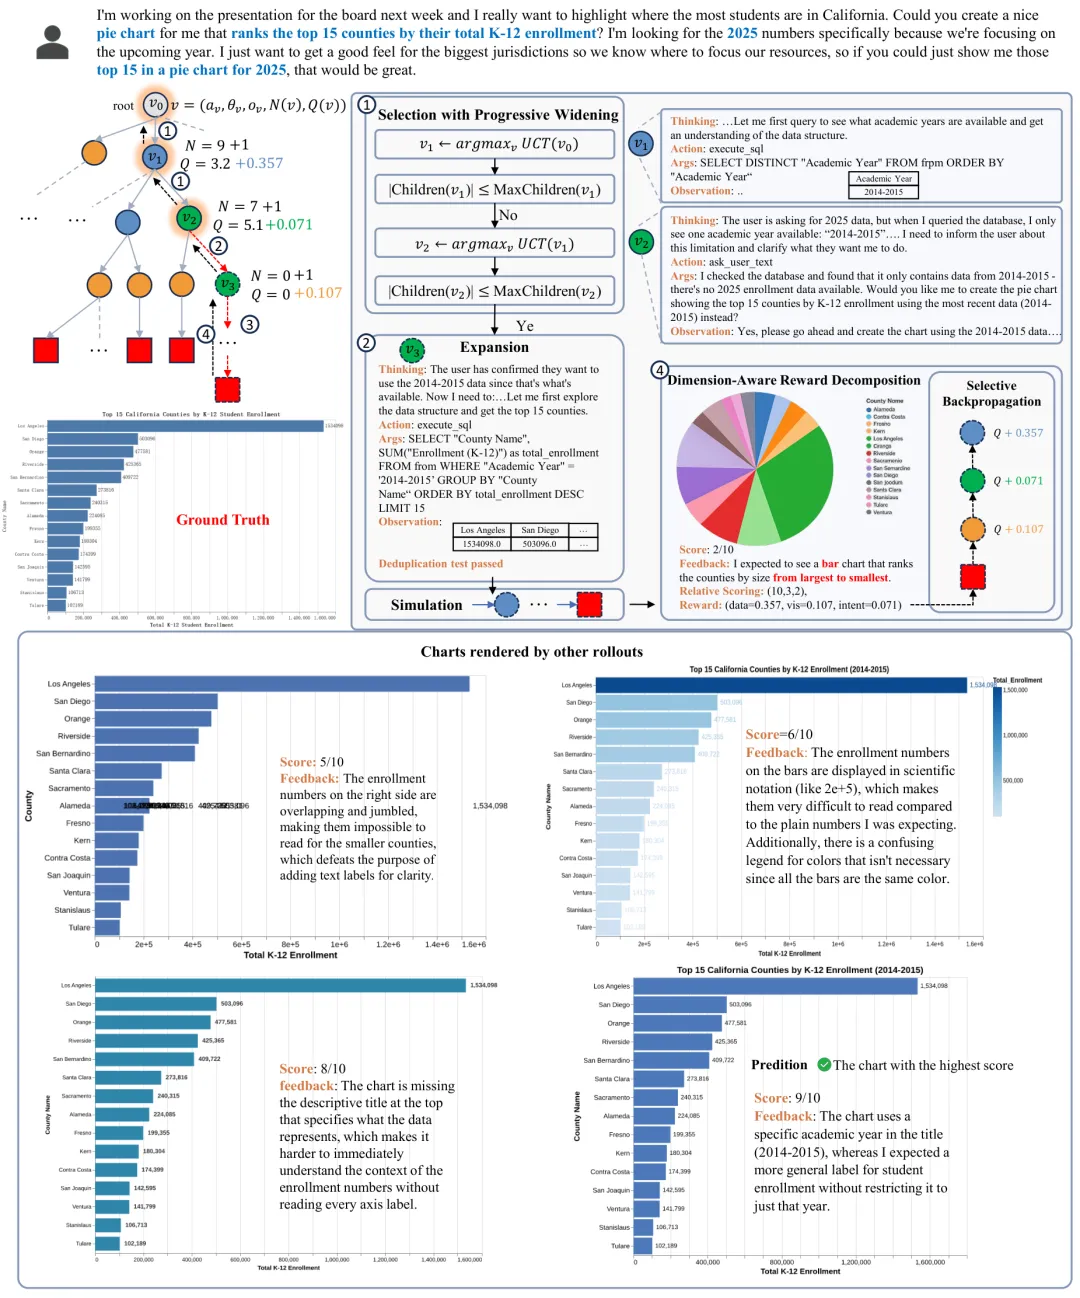
Figure 4: Cases of interaction with Vis-MCTS. The system never completes a complete query by asking and viewing feedback, gradually converting it into the image the user really wants.
Summary and Prospects
The value of this work is not just to propose a new drawing method, but to complement both the evaluation and the method at the same time: Text-to-Vis should not be simply "a sentence in, a diagram out", but should never find real intent in imperfect queries. VisInteract-Bench allows evaluation to acknowledge that inputs can be ambiguous, missing, or even wrong; Vis-MCTS determines when, what to ask, and the next step after users look at the drawing is to change the data, change the design, or change their own understanding of the intent.
Of course, the user agent that simulates the user is more expensive than the real user feedback ideal, and multiple rounds of search is more expensive. In other words, this work is not the end, but it makes it more clear that the graphics system has an intermediate process of "first ask, then pair". In the future, if further combined with more authentic user feedback, richer visualization grammar, the system may not only deliver more accurate images, but also better explain "why is it so".