The authors of this paper are from the National University of Mongolia, Shanghai Financial University and Carnegie Mellon University (CMU). The first author is a Ph.D. student at the National University of Mongolia, the author of the communication for a researcher at the National University of Guangzhou.
Flow matching or diffusion models are used to generate a handwritten digital image, a sequence of DNA that usually starts from noise and takes multiple steps to be sampled. Each step requires the model to be called, the quality of the production gradually improves, and the computational cost increases.
Is it possible to call a single model to complete the entire production process?
For characters, two-value pixels, and DNA-based discrete data, the difficulty is also: the space where the probability of a class is has its own geometric structure, and how do you generate paths that go straight through that space?
The research team proposed Rectified Statistical Flow (ReSFlow): mapping the probability of a category to the sphere, re-pairing and aligning the flow generating trajectory on the sphere, enabling the model to complete the generation along the path closest to the metering line through a single update. In binomial MNIST, ReSFlow obtained a model call with a generating mass approaching Statistical Flow Matching (SFM) 34 times.
Currently, the work has been accepted by NeurIPS 2026.
ReSFlow: Rectifying Categorical Flows on Statistical Manifolds for One-Step Generation
Address of the paper:https://arxiv.org/abs/2610.13225
The code address is:https://github.com/xiaohuanjia/ReSFlow
Background of research
Spatial data generation usually starts with category probabilities: for example, A, C, G, T in DNA can be represented as four nonnegative and 1 probabilities. The model learns how these probabilities change over time and then progresses through ODE, with the final sampling resulting in a spatial distribution. SFM introduces Fisher-Rao geometry to construct training paths using geometric lines in probability space, but there are still two difficulty points to achieve step generation.
First, the training path is a line of measurement, but the actual path taken when the model is reasoned is not necessarily. Independent random paired condition paths can cross at the same time, giving different directions. The model needs to integrate these directions, and the trajectory learned can be curved, predicted at a single speed from the starting point, and it is difficult to accurately reach the end.
Second, the "straight" in the Euclidean space is not equal to the "straight" in the probability space. Rectified Flow generates trajectories by re-pairing straight lines, but the Euclidean line is different from the Fisher-Rao line. The paths of the two Euclidean inserts can still be crossed even if they are not interchanged.
ReSFlow solves exactly these two problems: mapping the probability of the category to the sphere, re-matching and training in spaces in accordance with the Fisher-Rao geometry, bringing the actual generated trajectory closer to the measurement line, ultimately achieving step-sampling.
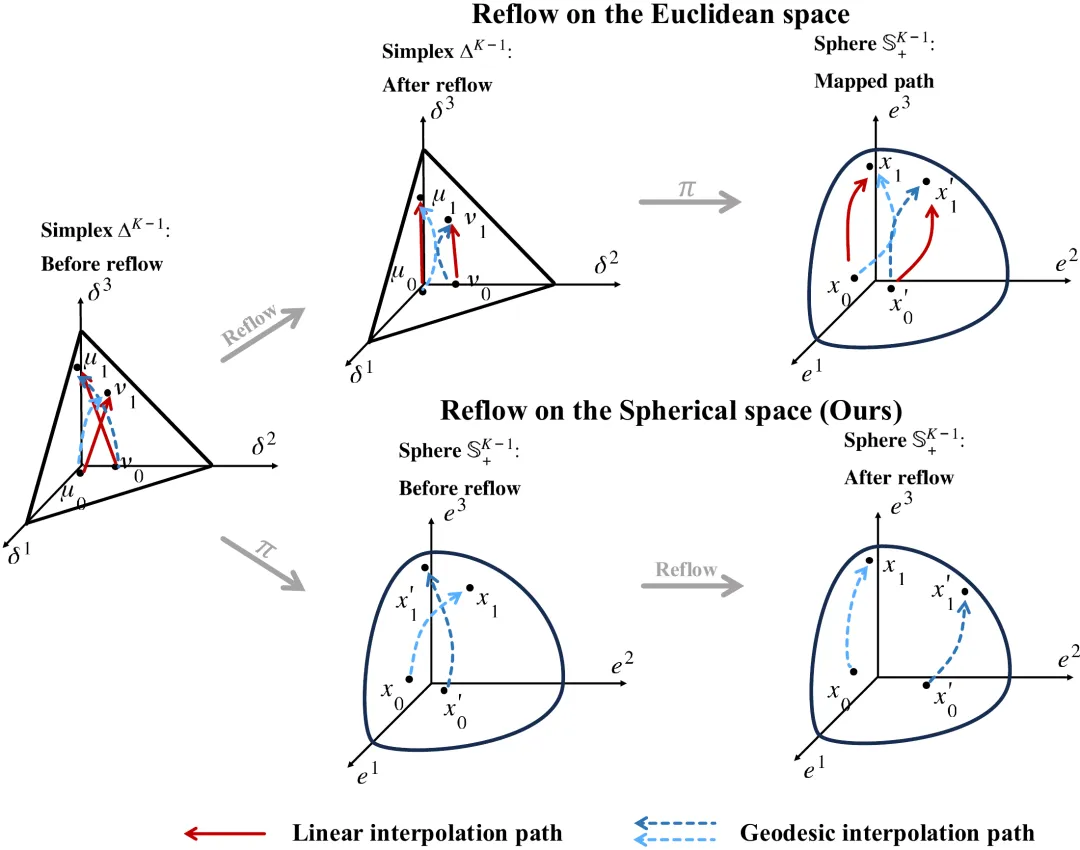
Figure 1: Difference between Euler's total flow and the total flow of the ball. Even if the linear paths in Euler's space do not intersect, the corresponding spherical geometry lines can still be crossed; ReSFlow flows directly across the ball.
Core Methods
In order to make the generated path truly "go straight", it is necessary to select a pair of spaces. ReSFlow first uses square root mapping to bring the sample points to the surface of the sphere, and then lets the initial flow model start from the noise and find its own end. With these new pairings, the model gradually learns to move forward along the terrain, finally using spherical index mapping, achieving a step-by-step generation from noise to data.
The spherical surface represents the value inserted with the measuring line
ReSFlow is a category probability vector Each item takes a square root and maps it from the probability simple to the non-negative area of the unit supersphere:
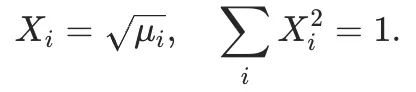
The square root mapping allows the Fisher-Rao mapping line to correspond to a large circle arc on the sphere, with only fixed constants differing between the two measurements. ReSFlow then uses the sphere-linear insertion value sslerp to connect the distribution of the starting points on the given sphere. and final distribution
 :
The linear insertion value of this sphere, which is the conditional speed required to train the flow model on the sphere.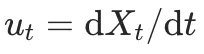 The model's predicted velocity is mapped to the intersection space at its current location, so that the model predicts the velocity at the moment following the geometry of the Lyman sphere.
Flow across the ball: from random mating to model mating
Stage 1: Allowing the model to learn to move from noise to data. This stage and the training of traditional flow models, separated by random sampling from prior distribution and data distribution, is mapped to the spherical surface to construct geometric lines, allowing the model to predict the velocity of rotation.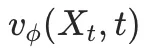 Speed of matching conditions:

This phase establishes a flow of generation from noise to data, but there is a large number of intersections between the independent pairing of the corresponding conditions, and the overall trajectory of the model learning remains distorted.
Stage 2: Let the model continue to learn on a cross-reduced trajectory. After completing initial training, ReSFlow starts at a sampling point from the previous distribution and then uses the current model to solve the spherical ODE to get the output endpoint that the start point actually reached:

Subsequently, the starting point and the generating endpoint are re-trained as a new pair, along the spherical surface trajectory lines between the two ends. Due to these paired ODE trajectories from the model itself. Under unique conditions, the trajectory cannot continue to move at the same time, at the same location, in different directions. So the model reorganizes the movement direction at the intersection of the original condition trajectory. This pairing method significantly reduces the intersection between the condition trajectories, making the model's learned overall trajectory closer to the spherical surface.
Step by step generation
After matching the previous adjustments and training, the trajectory learned by the model is gradually approaching the measurement line. The ODE does not require repeatedly updating the direction along the path, only predicting a speed in the intersection space at the initial noise point, then mapping the spherical surface index, and directly estimating the generating endpoint along the corresponding great circle arc:

After getting the end of the ball, square the coordinates and restore the probability of the category:
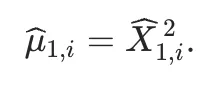
Select or sample discrete categories based on the recovered probability distribution.
The results of the experiment
The authors first synthesized the Swiss roll distribution to see if the model could step-by-step restore the target distribution and verify the model's effectiveness. They then used ReSFlow for real-world tasks such as image, text and DNA sequencing tasks. In addition to the comparison results, the paper added analytical experiments to verify whether the integrated flow makes the trajectory generated by the model more aligned with the spherical lines.
Testing experiments
In the Swiss roll synthesis distribution, ReSFlow generated 1,000 samples of ODE samples with a time of 0.0361 seconds, the shortest of the four methods; SFM took 0.0679 seconds. The NLL of ReSFlow was −2.25, better than LinearFM and R-LFM, but still slightly higher than -2.38 of SFM, the lower the NLL. The results showed that the entire ball flow shortened sampling time while maintaining better probability modeling performance.
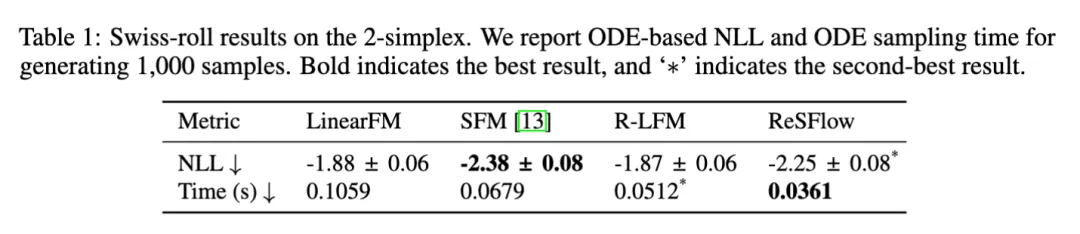
Table 1: Swiss roll experimental results. Compare the NLL in a complete ODE sample, and the time taken to generate 1,000 samples.
Semi-sampling generated samples more intuitively reflect this conclusion, with the real distribution presenting a curved band structure in a pure form. LinearFM and SFM without integrated flow cannot restore this shape, with the generating points concentrated in smaller areas; while ReSFlow maintains a complete curved structure, the distribution is closer to the real sample.
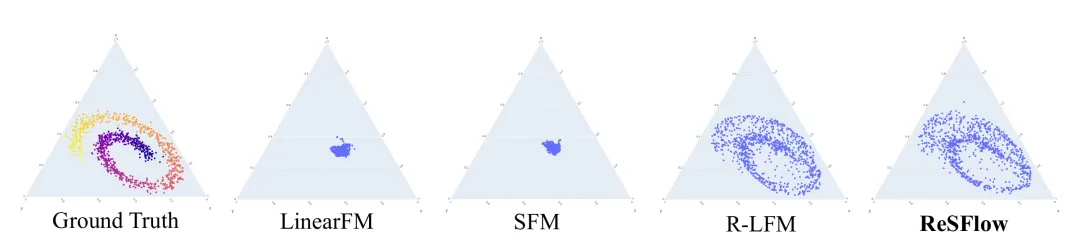
Figure 2: Swiss roll real distribution and step generating samples. This is followed by real distribution, LinearFM, SFM, R-LFM and ReSFlow.
The main experiment
In the binomial MNIST dataset, the step FID of LinearFM and SFM without integrated flow is 25.317 and 35.640, respectively; after integrated flow, the R-LFM decreased to 6.261 and ReSFlow further to 5.973.
The FID of SFM is lowest when complete ODE samples are taken; however, its mass loss is significantly greater after step compression. ReSFlow maintains the FID from 5.541 below complete ODE at step sampling 5.973.
The paper also compares the number of calls made by different models: ReSFlow generates a one-time call, which is close to the result of 34 calls made by SFM. The FID for SFM is 5.922, and ReSFlow is 5.973.
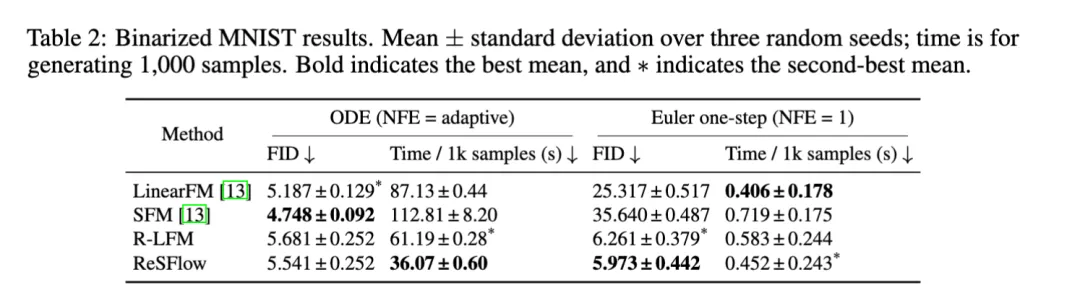
Table 2: Valued MNIST experimental results. Compare the complete ODE with the FID and the time taken to generate 1,000 samples.
The sample graph illustrates this group of differences more intuitively. In complete ODE sampling, all four methods can produce clearer handwritten numbers; after step reduction, linear FM and SFM pencils are clearly missing, and some numbers are difficult to identify. ReSFlow retains more complete pencils and outlines, and step generated samples are closer to the results of their own complete ODE.
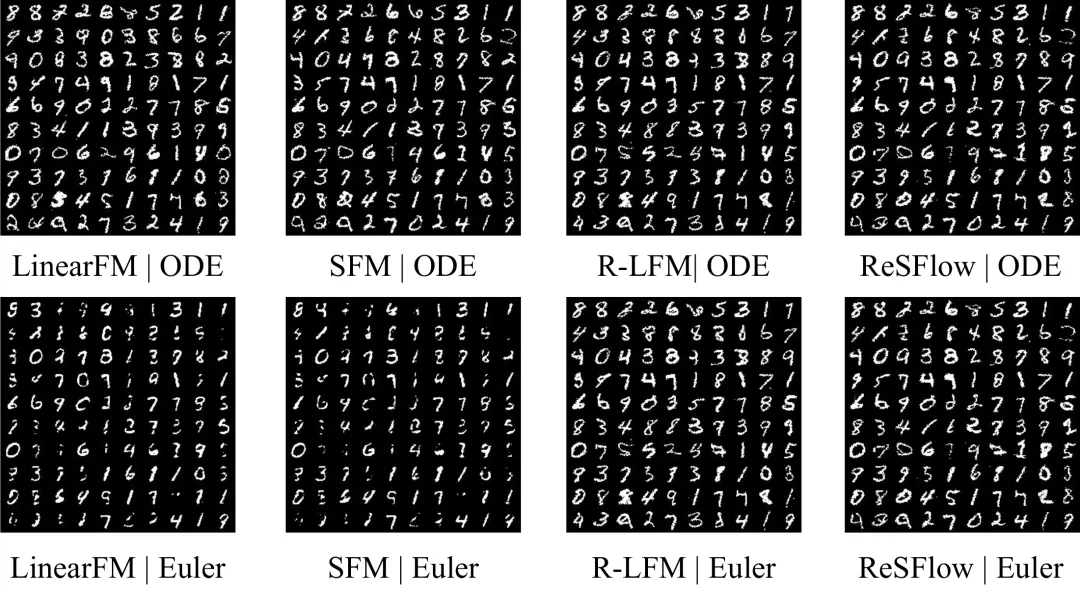
Figure 3: Two-valued MNIST generated samples. The top row is a complete ODE sample, the bottom row is a step sample; the columns are LinearFM, SFM, R-LFM and ReSFlow respectively.
For text generation tasks, ReSFlow's BPC is 1.26146, lower than SFM's 1.82998. This is not helpful here: R-LFM's BPC rises to 3.26687, worse than unintegrated LinearFM.
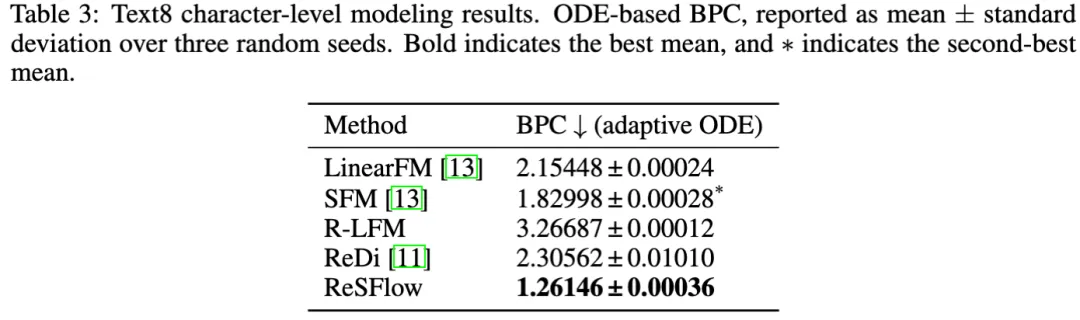
Table 3:Text8 character-level modeling results. BPC uses a complete ODE likelihood evaluation calculation to report the mean to standard deviation of three random seeds.
The condition-initiated sub-design task will replace the object with a DNA sequence of 1,024 in length. The ReSFlow step sampling SP-MSE is 0.028718, the full ODE sampling is 0.028743, and the predictive activation spectral error of both approaches.
The average time taken to produce 1,000 series was shortened from 67.94 seconds to 0.409 seconds, accelerating by about 166 times. By contrast, after SFM was compressed to a step, the SP-MSE rose from 0.028015 to 0.035564, and the loss of mass was more pronounced.
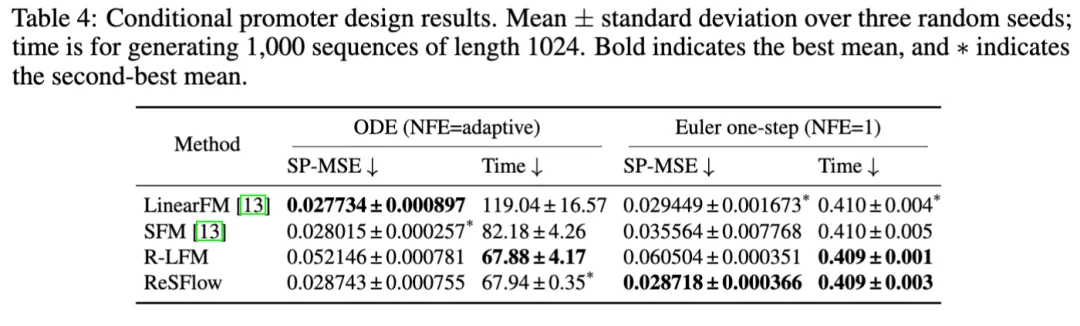
Table 4: Conditional start substrate design results. Time matches generate a sequence of 1,000 items of 1,024 in length, reporting the mean to standard deviation of three random seeds.
Figure 4: A generating sample of the conditionally initiated sub-design task. From top to bottom, LinearFM, SFM, R-LFM and ReSFlow respectively. A complete ODE sampling of each group behaves, followed by a behavior step sampling (Euler) showing the first 120 initiation sub-sequences in a sequence of 1,024 bases of length in each row.
Analysis of experiments
If the result is improved, is the trajectory generated by the model actually more "straight"? The authors recorded transmission costs and geotechnical deviations in the entire flow process on the binomial MNIST.
Transmission costs measure the cost of the distance between the noise start point and the generating endpoint. ReSFlow's transmission costs decrease significantly with the flow, indicating that after repair, the model tends to send the noise sample to the generating endpoint closer to the geometric distance, reducing unnecessary long-distance transportation. R-LFM's decrease is smaller in comparison and reaches the platform earlier. These results show that improved pairings in Euclidean space do not necessarily reduce transmission costs in probability spaces equally effectively.
The closer the two approaches, the closer the trajectory the closer the model actually goes to the steady-state trajectory. As the total number of flows increases, the gradient gradually decreases, supporting ReSFlow's core idea from the experiment: the globular flow allows the trajectory the model actually generates to be closer to the steady-state. The trajectory is less steady, the speed changes are more in line with the rules of the steady-state trajectory, and a prediction at the starting point is more likely to describe the trajectory. This also explains why ReSFlow can be mapped, accurately estimating the number of steps needed to reach the endpoint.
Figure 5: Fisher-Rao experiments transmission costs and geotechnical deviations under different integrated circuits. The lower the numerical value, the lower the corresponding cost or deviation.
What is the meaning of this verse?
ReSFlow provides a pathway for step-by-step generation of discrete data: starting from the Fisher-Rao geometry of category probability, re-matching and integrating the trajectory on the spherical surface, bringing the trajectory of generation closer to the measurement line, and then completing the step-by-step sampling by index mapping.
Step-by-step reasoning still needs additional integrated flow training, and its effects on larger data and complex conditional tasks are to be explored. But this work provides a clear inspiration: to make a path "go straight", it is first necessary to define what is "straight" according to the geometry of the space in which the data is located.

© THE