In the face of these questions, multimodal models often need to first find the relevant area and then enlarge the view. But if the first step is to locate the wrong frame, subsequent reasoning may follow. The visual thinking chain allows the model to look at the margins, call tools to look for evidence. However, many methods still, like generating sentences, write the boundary box coordinates into text one by one.
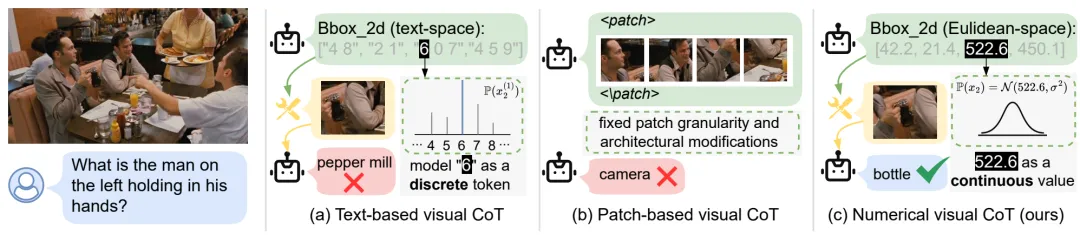
Figure 1 Three regional options: text coordinates, fixed patches, and continuous numeric coordinates for NV-CoT.
Researchers from the South China University of Technology, the University of Science and Technology of China, the National University of Singapore and the Microsoft Research Institute have proposed NV-CoT (Numerical Visual Chain-of-Thought): allowing the model to directly predict continuous numerical coordinates, turning regional choices into continuous actions that can be learned.
The first author is a Ph.D. student at the South Pacific University of Technology, who mainly studies reinforcement learning in polymorphic large models. Communication author Jubel is an adjunct professor at the University of Science and Technology of China, working mainly on polymorphic large model logic, image and video controllable generation, emotional computation, etc.
Thinking with Images as Continuous Actions: Numerical Visual Chain-of-Thought
Link to the paper:https://arxiv.org/abs/2602.23959v2
The main page of the project:https://kesenzhao.github.io/NV-CoT/
The code repository:https://github.com/kesenzhao/NV-CoT
Hugging Face:
Background and Challenges
Existing visual thinking chains typically output the boundary frames first, then call the cutting tool, and return the local image to the model (Fig. 1a). However, the texting of the coordinates poses two problems.
One is that the training goal does not match the spatial error. At a real coordinate of 3.1, the prediction 3.2 is closer than 4.1, but the token-level crossover is not punished directly according to this numerical distance setting. The second is that the numbers can be broken down into multiple sub-tokens, and the full location meaning is scattered into discrete sequences, increasing the difficulty of accurate generation.
For example, PaDT predicts the patch index that needs to be addressed. However, a patch is an image block that the visual encoder pre-allocates, and the model selects areas that are still constrained by the fixed grid, difficult to flex and precise framing objectives; the associated approach may also require more architectural modifications. NV-CoT maintains the original cutting process, directly outputting continuous coordinates, allowing the region to opt out of the constraints of the fixed patch boundary.
Contribution 1 To learn the exact location by returning the numerical values
In addition to the output head of the language model, NV-CoT adds four light-weight linear outputs that directly predict the coordinates of the upper left and lower right corners of the boundary frames. The text is still generated from the original word structure, and the coordinates are output via the numerical branch and then given to the tool to execute magnification.
In the supervision of fine tuning (SFT), the text continues to use crossbars, while the coordinates use regression loss. When L1 is set in the paper's main result, the common goal can be written as:

Where Ltext is a text cross-section, μt and bt* respectively are prediction frames and marking frames, Ta denotes the position of the coordinate action, λ controls the weight of the regression object. How much of the prediction position deviates can be directly reflected in the training goal. In the Vis-CoT-363K verification set, the positioning IoU increased from 47.3 to 59.5 on the Vis-CoT, an increase of 12.2 percentage points. This provides direct evidence for the role of continuous coordinates.
Contributing to Continuous Action to Enhanced Learning
When there is no middle boundary box marking, the model needs to try different regions and get feedback based on the final answer. NV-CoT has four coordinate prediction distribution centers, and adds a fifth output prediction sharing scale to control the exploration range of the boundary box.
NV-CoT uses the Laplace policy directly to model boundary frames as four-dimensional continuous distributions of dimensionally independent, shared scales with probability densities of:

When training, the boundary frame movements are generated by the following weight-parametric samples:

In this case, μ is the prediction frame coordinate, and α>0 is the shared scale, which controls the exploration width. The dimensions of s are independent of the positive negative number of probabilities, and the distribution of the unit rate index of e is independent of each dimension. The two elements are multiplied by the elements.
When accessing GRPO, the text uses discrete token probability and the coordinates use Laplace probability density. For the boundary frame movements sampled from the old strategy, the importance ratio of the new strategy is:
The ratio compares the probability density of the same action under the current and old strategies; the four sides come from four coordinates in the boundary frames. The combined group has the advantage of completing the strategy update, the rewards are still consistent with the correctness of the answer, the use of formatting and conditional tools, without the need to mark the middle frames.
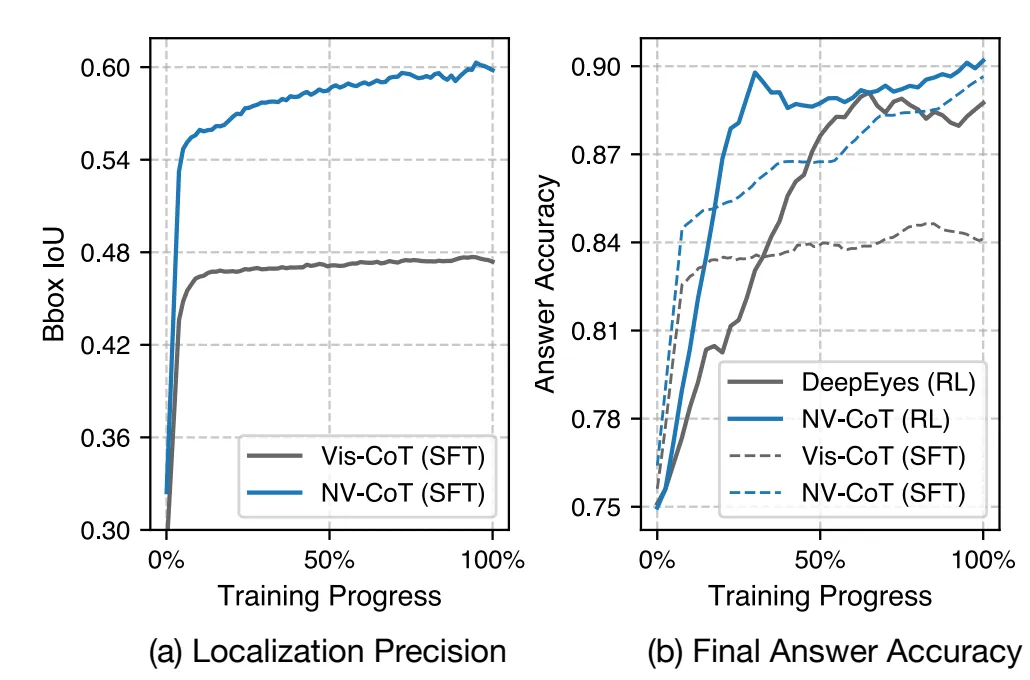
Figure 2 NV-CoT improves IoU positioning and response accuracy relative to their respective frameworks, and shows a faster convergence trend. The SFT and RL curves are evaluated on their respective datasets respectively.
The highlights of the experiment
Research on V* Bench, HR-Bench 4K and HR-Bench 8K evaluates and examines properties, spatial relationships and particle perception in high-resolution images, respectively. NV-CoT uses training data and configurations along corresponding frameworks to test the benefits of coordinate modeling.
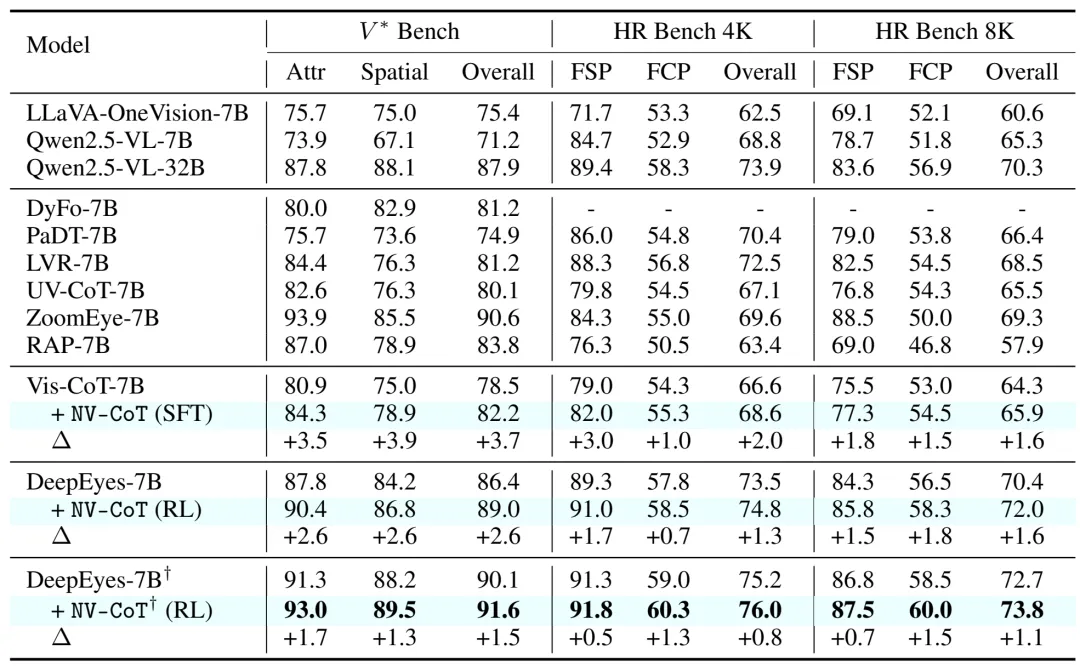
Table 1 Complete experimental results of three high-resolution benchmarks.† Multiple-amplification and single-amplification settings; SFT uses L1 loss and RL uses Laplace strategy. The higher the score, the better.
Both training routes were upgraded. The SFT improved by 3.7, 2.0 and 1.6 percentage points, respectively, over the three Overall versions of Vis-CoT; and the RL single enlarged version improved by 2.6 and 1.3 and 1.6 percentage points, respectively, over DeepEyes.
Multiple enlargements are still beneficial. In the same multi-tool call setting, NV-CoT increases 1.5%, 0.8 and 1.1 percentage points compared to DeepEyes. Different call budgets should be compared; V*Bench scores are still lower than ZoomEye's 90.6 in single settings.
Revenue extends to other visual tasks. Relatively DeepEyes, NV-CoT improved 2.1 points, 2.6 points and 1.5 points on MMMU-Pro, ChartQA and OCRBenchv2, respectively, and improved on target positioning and counting tasks.
The positioning improvements can also be seen intuitively: in the handbag color problem, the original model was framed to the stone wall and the ground, while the NV-CoT was aimed at the handbag; in the questionnaire, more accurate cuts helped the model read the correct $485 to avoid misplacing the nearby $685.
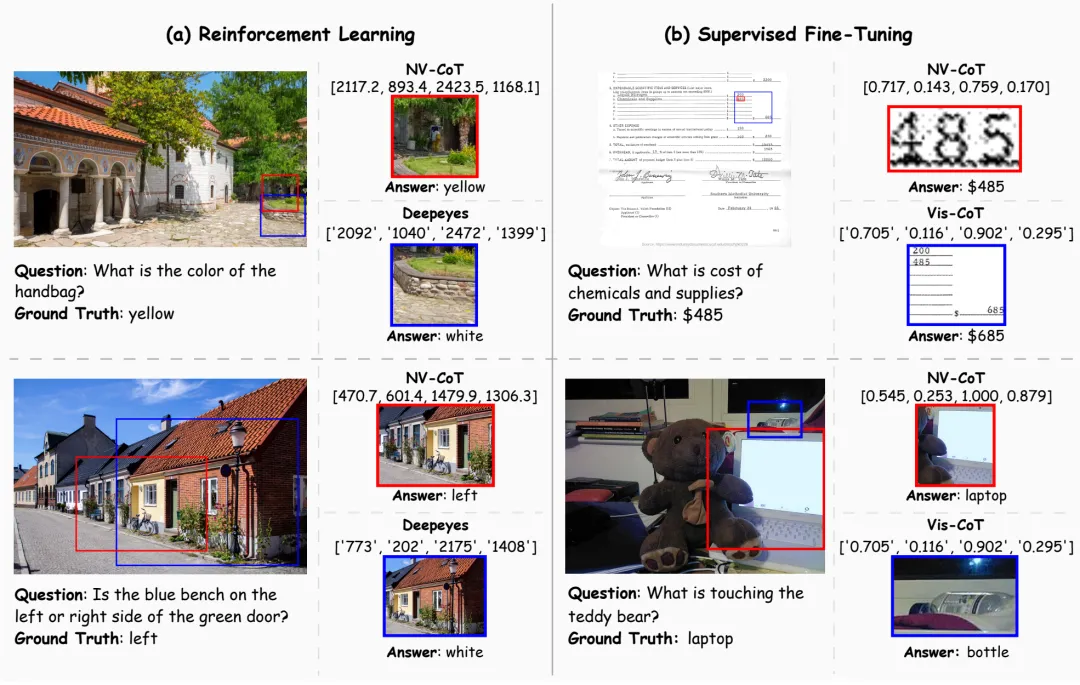
Figure 3 Contrasts positioning and response cases. The red box is NV-CoT, the blue box is the corresponding frame; the left row is RL and the right row is SFT.
What is the meaning of this verse?
NV-CoT suggests that "where to look" in the visual thinking chain can be learned directly by continuous numerical values, serving SFT and RL simultaneously with smaller structural changes. It mainly improves models that have largely understood tasks, but are inaccurately positioned regionally; accurate coordinates are still unable to accommodate subsequent reasoning when the semantic understanding itself is wrong.
© THE