Coding Agent is moving from the terminal world on the screen to the physical world off the screen.
In the past, the agent was primarily confronted with text: given a task, it called tools, modified code, ran tests, and finally delivered software. The whole process, in essence, took place between strings.
But now, more and more missions are starting to use "the visual world itself as input".
A process map, a web design sketch, a 3D scenario sketch, or even a whole page of PPT can all be the object of an Agent's understanding and rebuilding with code.
Visual Coding is about understanding a visual goal and transforming it into executable, editable code.
This looks like just one layer of visual input, but it actually introduces a whole new challenge: on the basis of ensuring that the code works, the agent must also understand objects, structures, spatial relationships and semantics from the visual input, and then encode this information accurately into the process.
So how can we both see where Agent has gone in Visual Coding and move it forward?
A good test carrier that has a sufficiently rich visual structure and can be programmatically expressed and edited.
PPT happens to meet both of these conditions. A page PPT is not a simple image, but a collection of editable objects composed of text, shapes, connections, groupings, and spatial layouts. It preserves both the structure in the visual world and gives a natural programmatic expression space. Visual similarity does not mean that it is semantically correct.
This is exactly what the latest release of PPTBench by Navers Lab at Einsia AI wants to answer:
"Can today's AI Agent really understand a visual target and translate it into code?"
PPTBench: Can Coding Agents Reconstruct the Visual World through Structured, Editable Slides
The main page of the project:
GitHub:
arXiv:
AgentGit ((see section of the review Session):
When the agent is no longer just writing code, it's understanding what the graph is saying.
PPTBench's mission is based on real-world scientific papers with process charts and architectures. The research team constructed 500 tasks covering 13 areas of systems and software, artificial intelligence, computer vision, language and speech, quantum and basic physics, astronomy, robotics, biomedical engineering, as well as various types of layouts, including multi-panel charts, layered structures, repetitive grid patterns, complex connections and text densities.
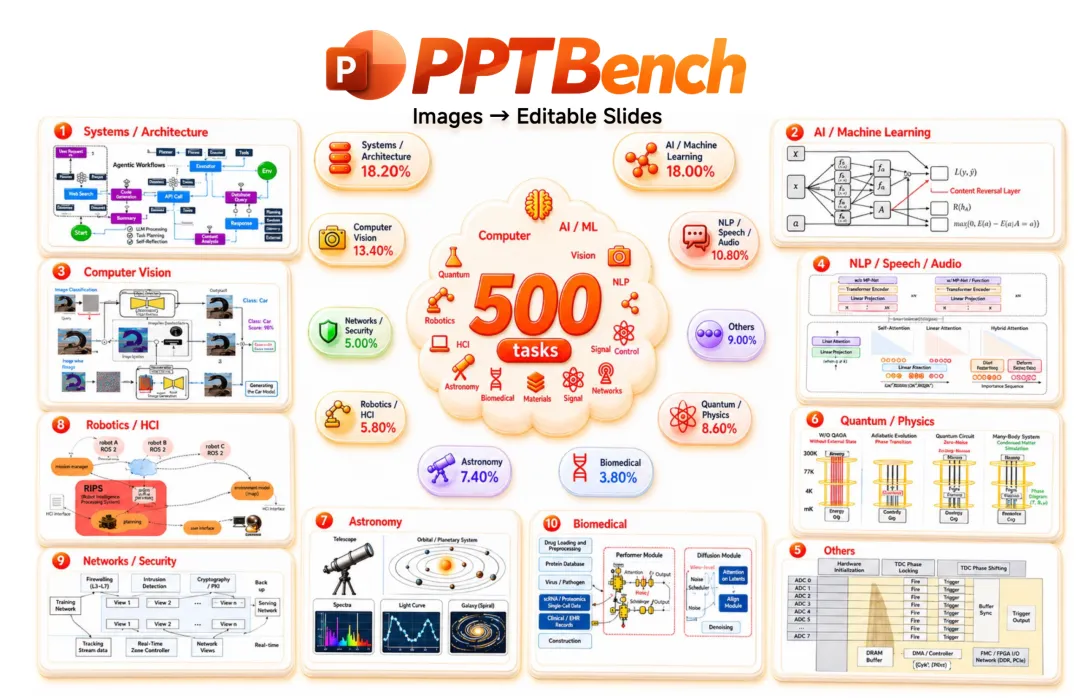
For Agent, the mission is very direct:
Give a flow chart and use the code to reconstruct it into a PowerPoint page.
The input is a defined visual target, and the output is a truly code-generated, editable PPTX. The agent cannot simply paste the original image into a slide, but needs native PowerPoint objects such as text, shapes, and connecting lines to re-express what it sees.
This is exactly where the real difficulty lies.
The agent must first understand the diagram: identify which nodes, texts, and relationships there are, understand where the connection line originates and points to; then write down what they understand: map these structures accurately to a two-dimensional canvas, process the size of the nodes, spaces, texts, and the location of the connections; and finally deliver a correct programmed product: the generated PPTX can open normally and the contents must be truly editable objects.
In other words, it's not easy to draw a picture.
It requires the Agent to solve three problems simultaneously: understand, write right, and deliver.
The process semantics are wrong, the graph is another algorithm; the geometric position is wrong, although it can still be understood, but it loses the precise structure of the original graph; the product itself has problems, so it cannot be viewed and edited continuously.
It is for this reason that a seemingly simple chip as depicted as a PPT chip has actually become a comprehensive test to test Visual Coding capabilities.
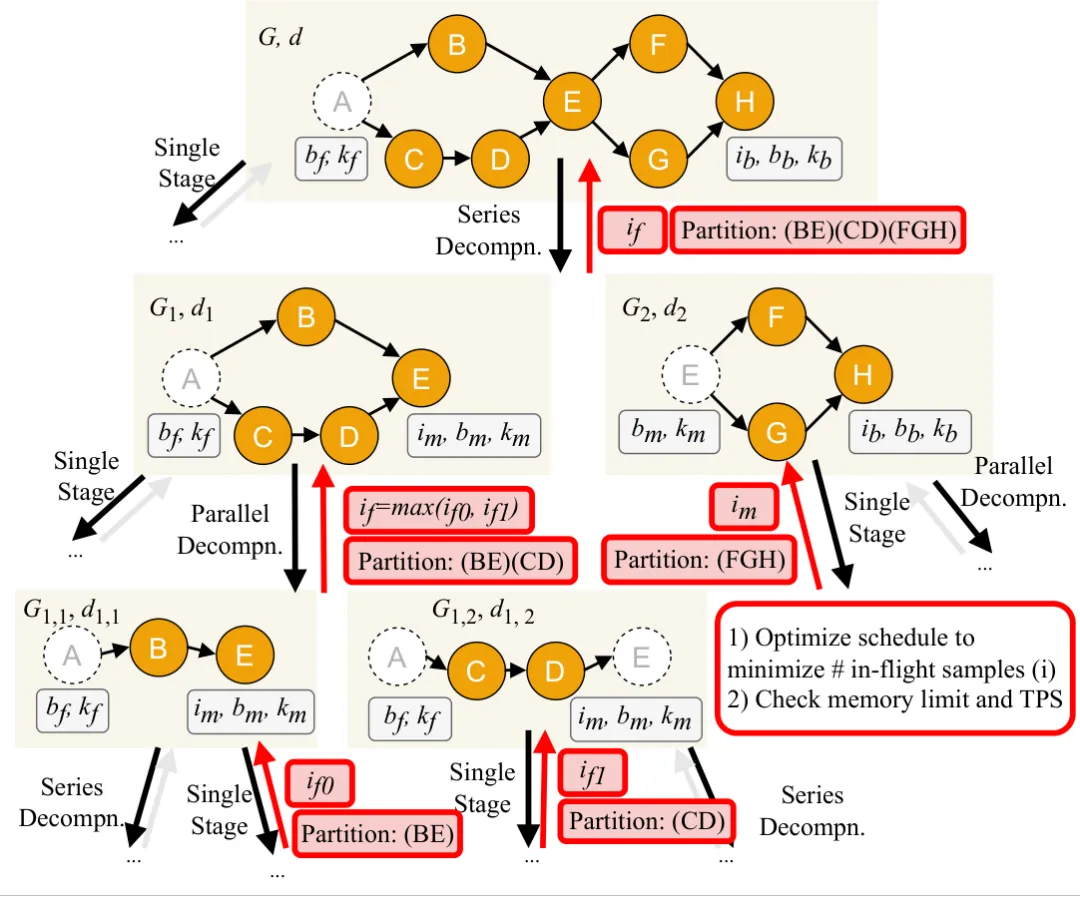
Input: A process map

Output: Agent reconstructed as an editable PPT
Agentic Judge: Let's make it easy for moms to understand moms and moms to be judged.
A recovered PPT may look almost identical to the original. But if it is essentially just a snapshot, it cannot be really edited; if the arrow is reversed, the meaning of the process expression changes with it; if a large area of rendering error, text overflow or severe overshadowing occurs, the entire slide even loses its basic readability.
What is more complex is that the same visual element in PPT can often have completely different object expressions.
A field diagram can be composed of four squares, or it can be composed of a square and two straight lines; a pair of vertices can be composed of two straight lines, or it can be drawn directly by a polygon.
PPTBench therefore designed an Agentic Judge. It did not require the Agent to rebuild according to a certain fixed object tree, but instead proceeded from the final delivery of the PPT to determine if it had actually completed the task.
The first is an Artifact Gate, which determines whether a product is eligible for formal evaluation. The judge will check whether PPTX can be properly parsed and rendered, whether a single-page slide has been generated, whether it contains enough native editable objects, and whether there are any direct attachments that do not meet the requirements.
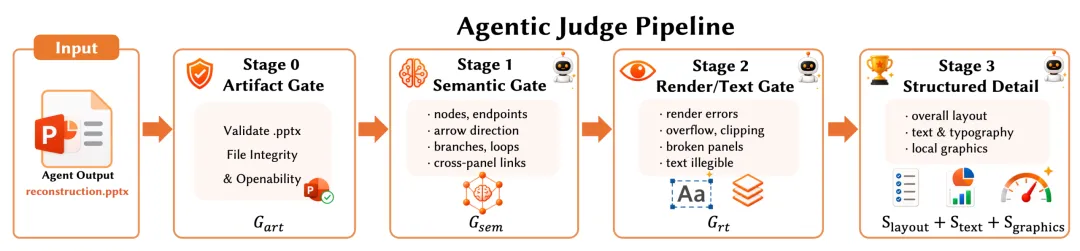
After passing Gate, Agentic Judge completed the three-phase evaluation in succession.
Stage 1: Judge whether or not you did the right thing.
This phase focuses on the most central question: whether the agent reconstructed the graph and is still expressing the original process. Judge will understand the reference graph and the generated results as a whole and judge whether the critical relationship has been correctly restored.
Stage 2: Reassess whether or not a monkey can see a monkey
After semantic correctness, the Judge further checks whether the generated results have a basic readability. Serious rendering problems or transcription errors may prevent the use of a semantically correct PPT. This stage mainly excludes such errors that affect the overall reading.
Stage 3: Final judgement on how much of a monkey is a monkey
After the first two nodes, the Judge enters the comparison at the level of detail. It further analyzes the overall layout and local visual differences and records the structural problems of the findings. It no longer requires two PPTs to use exactly the same object expression, but focuses on whether the final visual result presented is close enough.
In summary, the Agentic Judge did not simply ask that the PPT is not the same as the original, but instead answered three questions: is it right? can it see? is it bad?
How far away is Agent from stably recovering PPT?
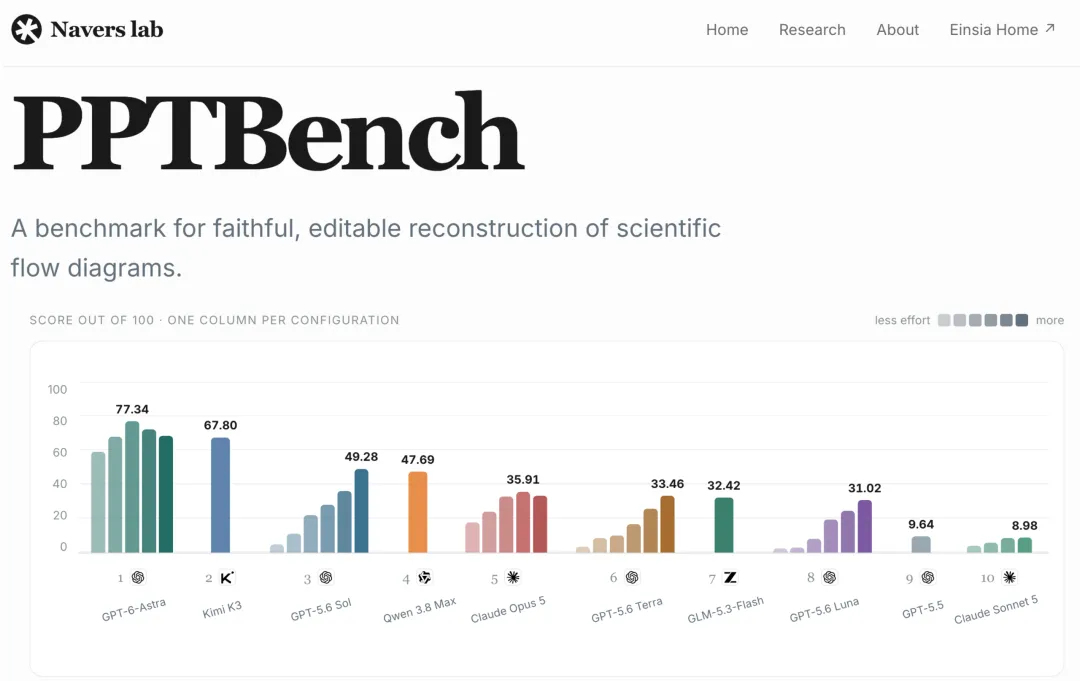
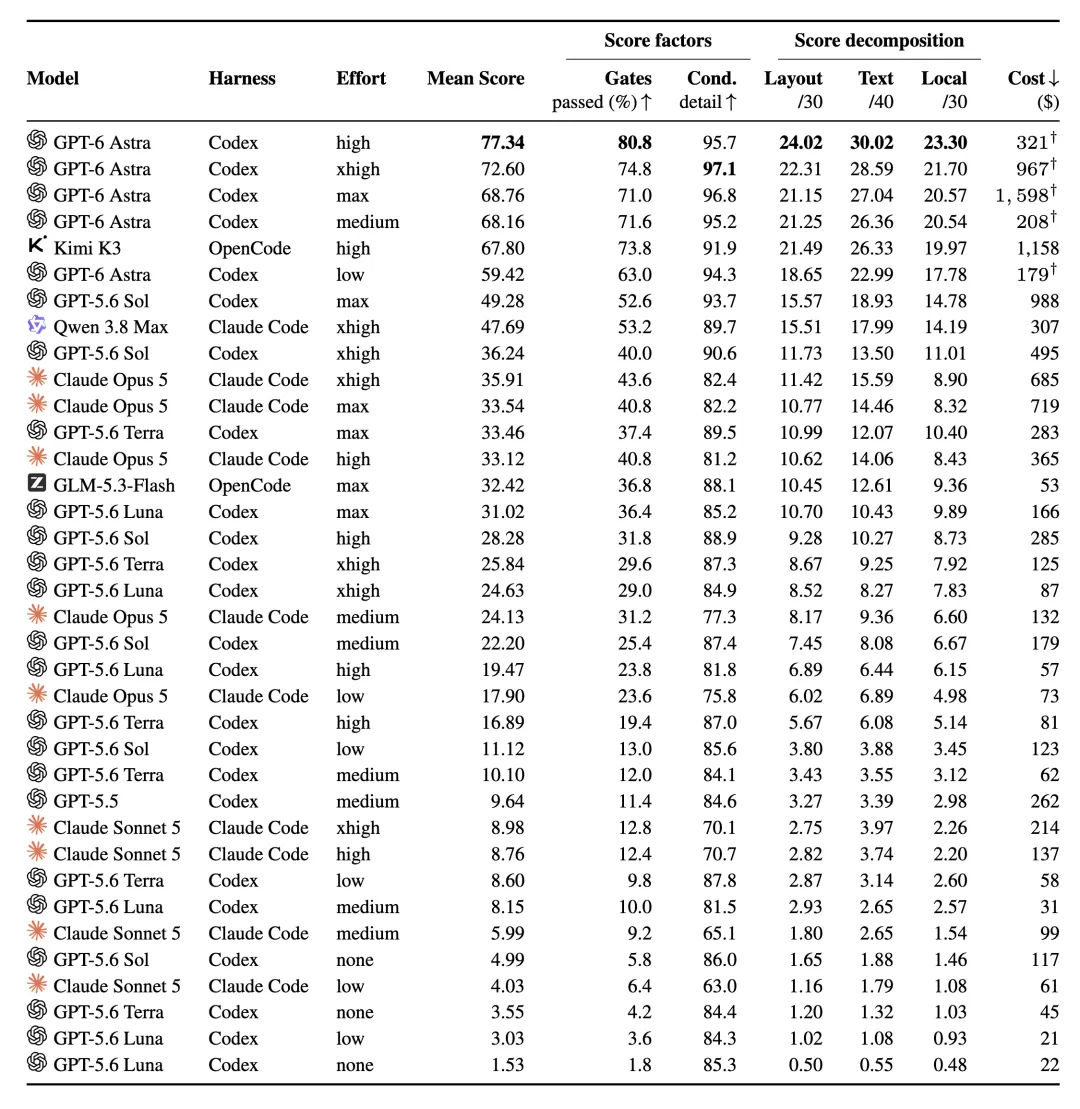
The team tested 10 models, 36 configurations, and each configuration completed the same set of 500 tasks. Each resulted in a three-round review, accumulating 54,000 review records.
GPT-6 Astra High topped the list with a score of 77.34. Out of 500 missions, GPT-6 Astra High produced an effective product, with 80.8% simultaneous through semantic and rendering checks.
Among other review models, Kimi K3 High performed best, scoring 67.80; GPT-5.6 Sol Max and Qwen 3.8 Max XHigh scored 49.28 and 47.69, respectively.
Astra's lead is clear, but even in this optimal configuration, nearly two percent of the missions have not been able to pass both checks simultaneously.
What is the problem with the model behind these scores?
Visual understanding is much harder than the code itself.
The difficulty of the model is not to write a file that can be analyzed correctly; it is to determine whether the file actually expresses the correct meaning.
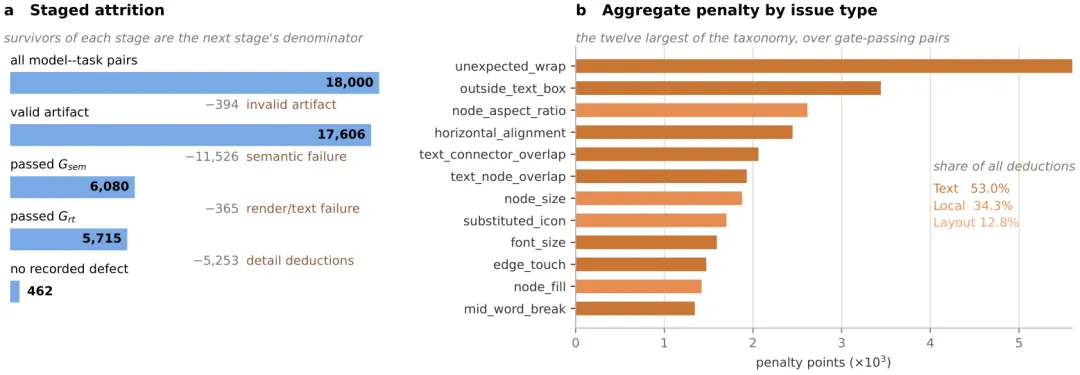
Of all 18000 results, 394 ((2.19%) did not pass product inspection; subsequently, 115,26 ((64.03%) of the total results were rejected due to process semantic errors. Out of the remaining 6080, 365 did not pass rendering/text gate control, and finally 5715 ((31.75%) entered the detail score.
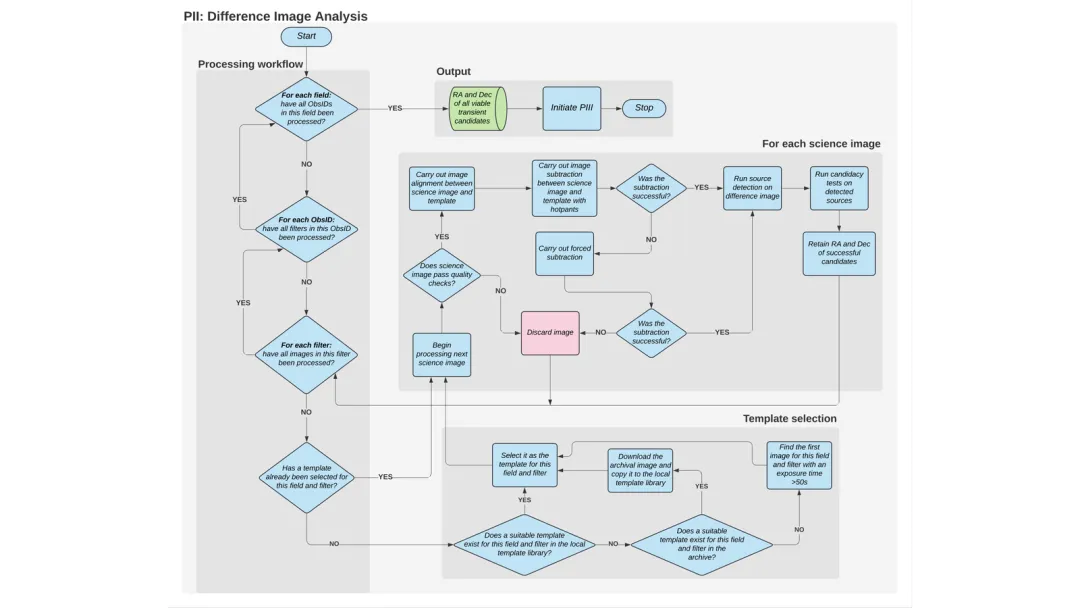
Input of the flow chart

Results generated by Astra 6 without semantic gate control
In the entry details rating products, text and editing issues contributed 53.0% of detail deductions, local graphics accounted for 34.3%, layout accounted for 12.8%.
These are problems that cannot be intuitively represented by the file code itself. A script that generates PPT itself does not tell whether the text rendered by the model will be replaced where it should not be, or whether the entire text box will be blown up; but this is the most obvious problem among the products that are actually rendered.
Only models that are truly capable of visual censorship and iteration can truly discover and solve these problems.
More thinking is about understanding the process rather than rebuilding the details.
Increased reasoning effort and gains mainly reflected in higher gate control pass rates.
GPT-6 Astra jumped from Low to High on average from 59.42 to 77.34, up from 63.0% to 80.8% through full gate control, up 17.8 percentage points; and from 94.32 to 95.72 on condition details through gate control.
But more thought did not guarantee higher scores. The average score for the Astra five grades was Low 59.42, Medium 68.16, High 77.34, XHigh 72.60, Max 68.76 respectively. From High to Max, the gate control pass rate dropped from 80.8% to 71.0%, although the details of the conditions after the gate controls increased to 96.85, and the total score still dropped.
This shows that the main benefit of thinking deeply is that more products retain the correct process, while the improvement in detail accuracy is relatively limited. Astra's best performance at High also reminds us that bringing effort to the highest level may not be a reliable default option.
"Look back" to make the model better.
The process by which models construct PPTs is not the same as in humans.
Humans write the components one at a time; models write a complete PPTX to produce a script and then adjust it based on visual feedback.
Analysing the call trajectory of the model, the paper found that more models performing visual inspections of their own products often scored higher.
Among the 27 configurations that analyzed the call trajectory, the model examined the Pearson correlation coefficient for the number of rounds with scores of 0.881; in contrast, the correlation coefficient for the number of rounds with scores was only 0.255.
Visual scrutiny gives the model the most direct feedback, allowing the model to make direct judgments about what to do next: adjust the node spacing, change the direction of the arrow, or fix the rendering problem.
This is at the heart of Visual Coding:
"When a model is able to decide when to observe, understand what it sees, and make the right adjustments, the visual task is the next milestone".
PPTBench wants to answer, not just who's the strongest
A scientific process map is not a decorative poster. At the same time, it carries process semantics, spatial relationships and a great deal of local detail: the process of expressing the missing or exchanged nodes of any arrow is completely different.
PPTBench's experiments suggested that the front-end Agent was already able to complete a fairly complex visual reconstruction. However, there was still a significant distance between the prototype and the stably restored prototype. Semantic understanding was the main bottleneck, and once semantically correct, text, layout and local details became new challenges.
Therefore, PPTBench wants to measure not just how well a model can make a PPT, but a more basic question:
"When an Agent sees a visual target, can it really understand its structure and put that understanding reliably into code?"
This is a real problem that needs to be addressed in the next phase of Visual Coding.